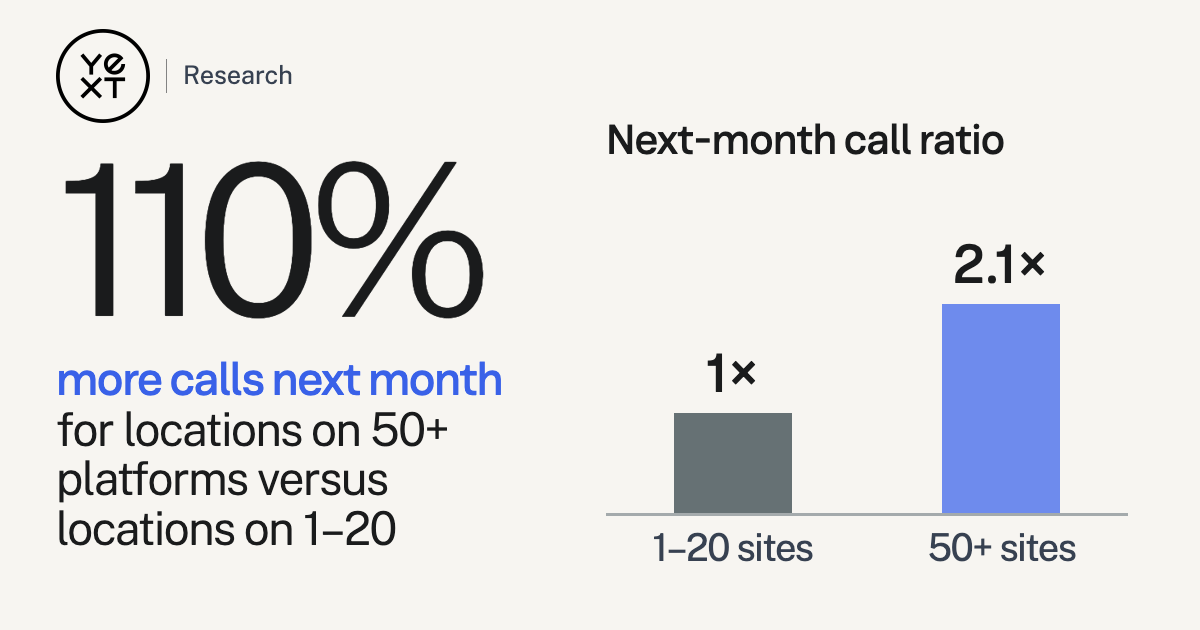
Calls were 110% higher the next month for locations on 50+ live platforms than those on 1–20.
1–20 sites50+ sites
What this measures
Calls were 110% higher the next month for locations on 50+ live platforms than those on 1–20.
Published percentage is used as reported. Bars show the relative ratio implied by +110%, with the 1–20 group indexed to 1; they are not raw call counts.
Where this number comes from
Read Study 02 in the reportStudy 02 headline comparison and Figure 4Active Digital Presence Goes With More Customer Actions| 1–20 sites | 1× |
|---|---|
| 50+ sites | 2.1× |
- Measurement period
- Study 1: 90-day listing checkpoints; Study 2: July 2025–July 2026; Study 3: August 2025–July 2026
- Source verified
- · next review
Applies to
More from this report
- 150%Locations on 50+ live platforms averaged 150% more total customer actions the next month than locations on 1–20.
- 163%Website clicks were 163% higher the next month for locations on 50+ live platforms than those on 1–20.
- 2.39×Actively managed locations appeared on checked platforms at 2.39× the comparison rate.
- 55%Among single-location businesses, the 50+ platform group had 55% more next-month total actions than the 1–20 group.