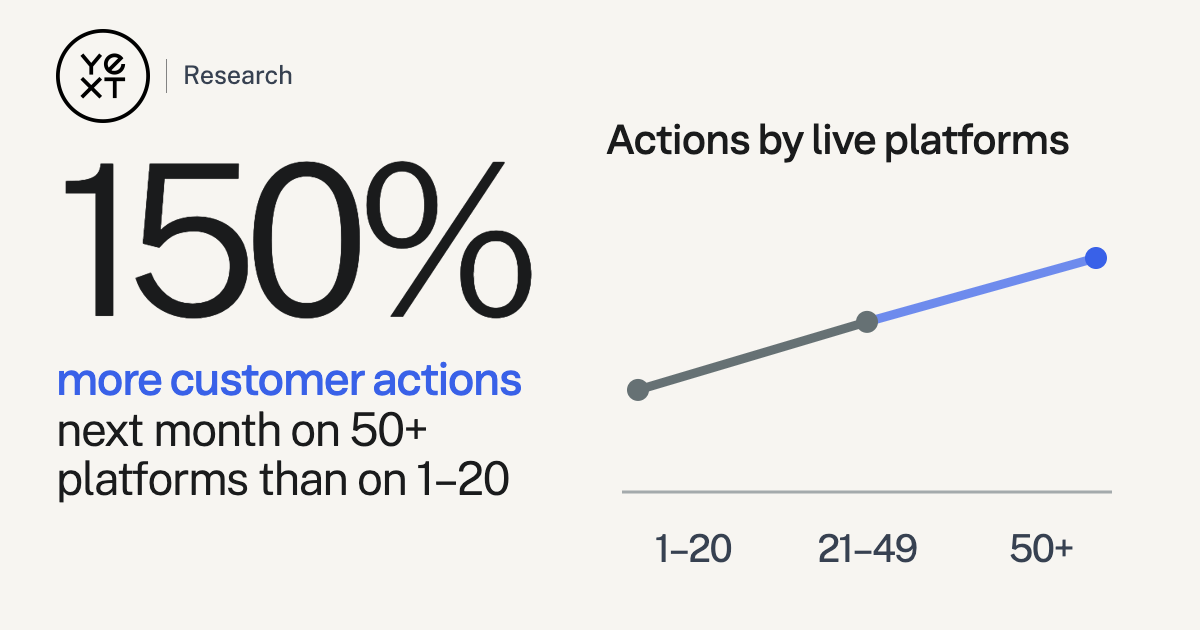
Locations on 50+ live platforms averaged 150% more total customer actions the next month than locations on 1–20.
1–2021–4950+
What this measures
Locations on 50+ live platforms averaged 150% more total customer actions the next month than locations on 1–20.
Observational next-month comparison, not a guaranteed gain from adding listings. Values 295, 523, and 737 are the published rounded averages for the three platform groups.
Where this number comes from
Read Study 02 in the reportStudy 02, Figure 3bActive Digital Presence Goes With More Customer Actions| 1–20 | 295 |
|---|---|
| 21–49 | 523 |
| 50+ | 737 |
- Measurement period
- Study 1: 90-day listing checkpoints; Study 2: July 2025–July 2026; Study 3: August 2025–July 2026
- Source verified
- · next review
Applies to
More from this report
- 110%Calls were 110% higher the next month for locations on 50+ live platforms than those on 1–20.
- 163%Website clicks were 163% higher the next month for locations on 50+ live platforms than those on 1–20.
- 2.39×Actively managed locations appeared on checked platforms at 2.39× the comparison rate.
- 55%Among single-location businesses, the 50+ platform group had 55% more next-month total actions than the 1–20 group.