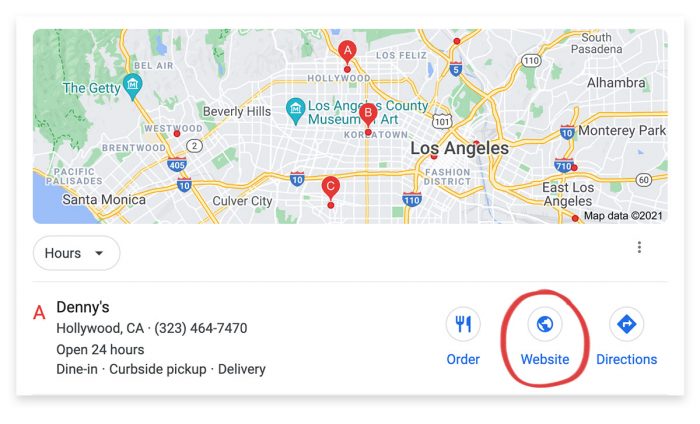
Yext Data Hub: Explore Consumer Behavior, Search Trends Across The World
With the majority of U.S business locations now reopened in some capacity, the countdown is on for a full return to "normal."

Theresa Salud
Jul 1, 2021

With the majority of U.S business locations now reopened in some capacity, the countdown is on for a full return to "normal."
Every vertical that saw severe disruption in the last year is eager to get back to business and, importantly, profitability. But where are we in that process? And what digital (and physical!) traffic trends should businesses keep an eye on — this year and beyond?
With the launch of our new interactive Yext Data Hub, you can find out.
In the new tool, users can apply custom country and industry filters to explore trends in search volume and consumer behavior from January 2019 until May 2021 — and stack up where their business stands in relation to others within their industry (with summer months soon to come — the hub will be updated regularly).
So, let's dive in to see the different ways you can utilize the new Yext Data Hub for your business or research needs, for purposes including:
- Analyzing Current Consumer Behavior Over Time
- Benchmarking Your Website Page Performance
- Taking a Deep Dive Into Industry Sub-verticals
- Looking At Data Across Geographic Regions
Analyze current customer behavior over time
One key way to measure consumer behavior near the bottom of the funnel is to look at clicks for directions and see how foot traffic to businesses might have changed since this time last year. But it's also important to understand how these year-over-year metrics might be impacted by a downturn in 2020 and a recovered 2021.
For example: By May, U.S. Food Services saw about 90% of the volume of driving directions clicks — a good proxy for "door swings" — they have seen in normal years (i.e. pre-COVID). But if you only compare May of this year to May 2020, you see that foot traffic is +162% higher this year. So, it's great to see the rebound, but it's also important to understand what we're trying to get at by comparing this year to both 2020 and 2021: this climb of 162% still only takes us to 90% of "normal" volume.
It's also important to understand the other types of clicks on search engines. While foot traffic was shaky in 2020, a lot of brands did start to see increases in website clicks on their listings — especially if they were set up well for a shift to more digital means.
Taking a look at the Website Clicks by Month trend, you can see how more and more customers rely on food businesses' websites to order delivery or pickup, confirm dining options and hours, and digitally make reservations instead of calling in via phone. In 2020, about 12**%** more users landed on Food websites from listings, and in recent months 40**%** more compared to 2019.
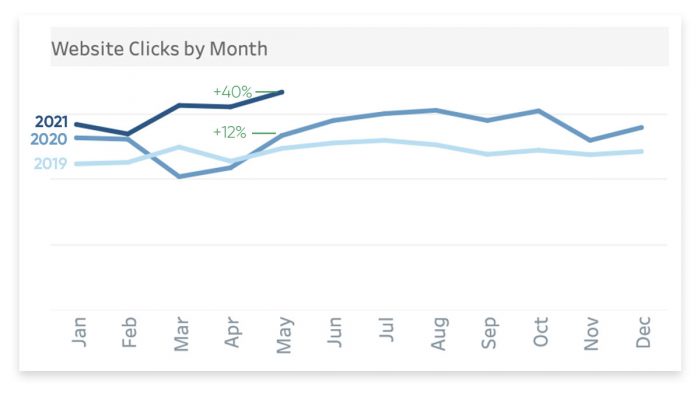
This shift to more digital means of interaction was in evidence across most verticals — not just food — and this trend has only accelerated as foot traffic begins to recover. Interestingly, as they reopen, it's actually more important than ever for businesses to have top tier digital experiences optimized for search and conversion.
Benchmark Your Website Page Performance
If you want to focus a little farther down the funnel in the customer journey, the Page Views and On-Page Clicks metrics are what you'll want to take a look at.
For instance, in the Financial Services industry, many financial advisors tend to seek insights into how well their personal advisor page is capturing leads in comparison to others advisors. Taking a look at Page Views for U.S. Financial Services businesses, you can see that web pages within the finance world have been getting around -4% to -29% of traffic throughout the pandemic compared to the prior year. So, lower page views to your advisor page doesn't necessarily mean you're losing ground to a competitor.
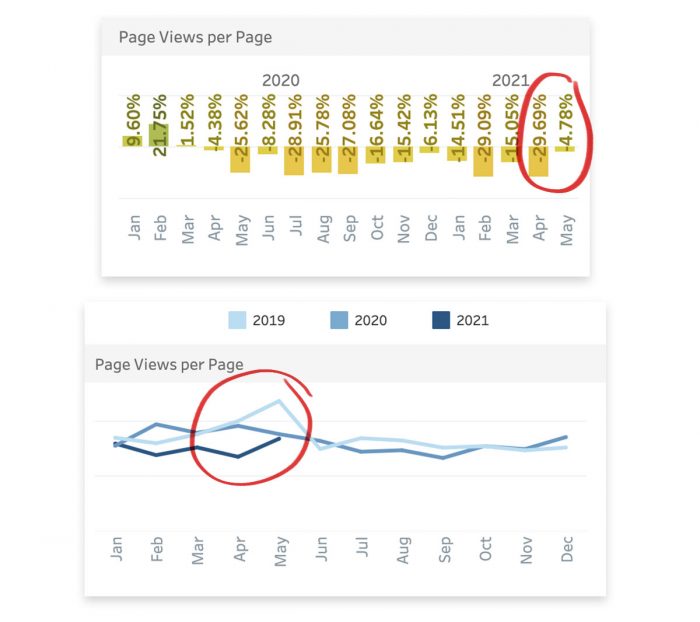
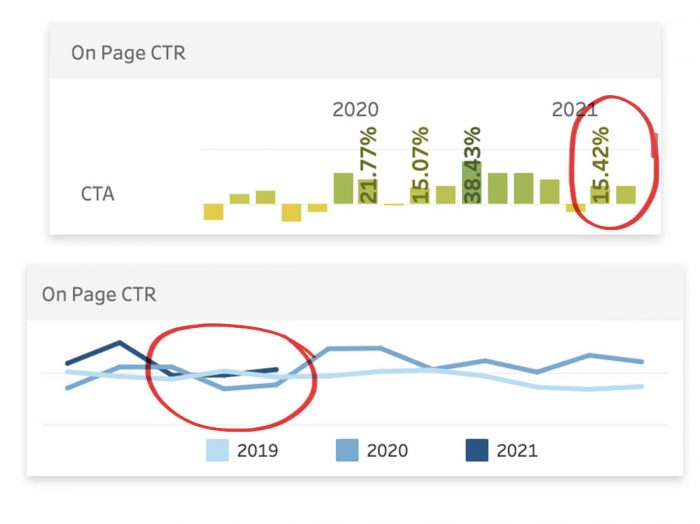
However, it's important to not only understand the trends in pages traffic, but to know what customers are doing on these pages when they visit.
The click-through-rate for Call to Action buttons on U.S. Financial Services pages has actually remained steady — and even increased up to +38% from previous years — during the pandemic. In May 2021, while we see -4.7% less customers visiting these pages, we see that +16% more customers are clicking on Call-to-Action buttons such as "Schedule an Appointment" or "Learn More" compared to the prior year. This shows us that those who do visit show high intent, and actually take meaningful action.
Dive Deep into Industry Sub-verticals
In the examples above, we looked at the food services industries as a whole, but then we decided to look at Financial Advisors separately from the rest of the Financial Services vertical. Why?
Well, because trends might actually be drastically different within an industry. For instance, a large hospital might see very different trends from an urgent care facility, which would then be completely different from how people find and interact with their primary care physician or specialist. By selecting the Healthcare Vertical and drilling down into specific Healthcare sub-verticals, we can see a recent upward trend in elective healthcare businesses such as Dental Services, Eye Care, and Medical Specialities. Since February this year, search volume for these businesses has been +28% higher. The lesson here is to try looking at one or more sub-verticals in your industry — and see how they compare.
Look at Data Across Geographic Regions
Thus far, we've given examples across industries within the U.S., but the Data Hub has the ability to filter by 6 continents and 31 countries.
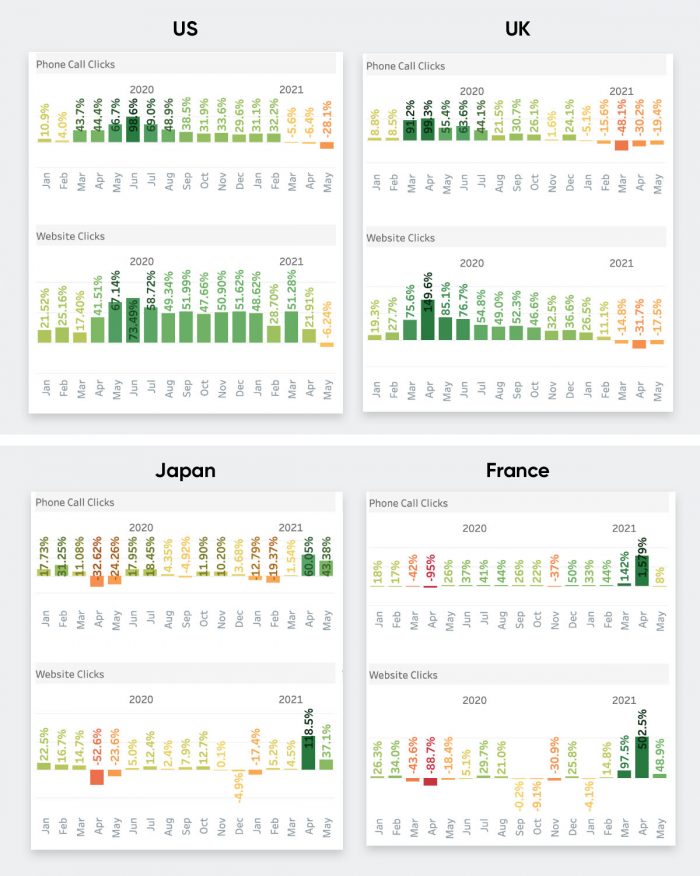
Taking a look at the Retail Industry, you can see how consumer behavior varies across different regions. We do see some similar trends in consumer foot traffic to Retail stores across the globe…
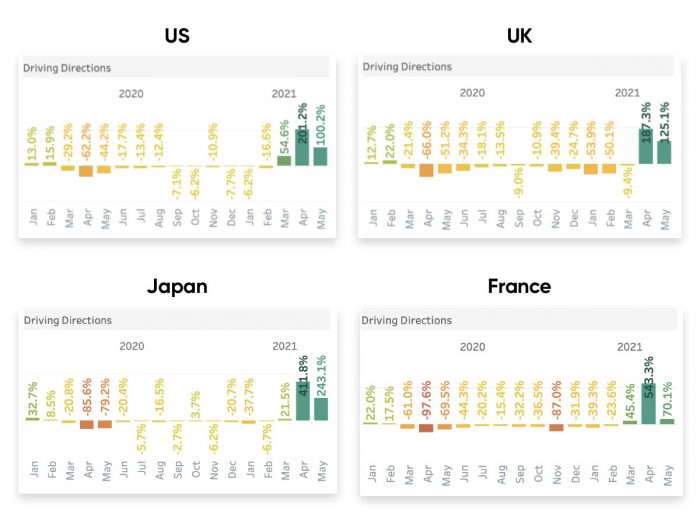
…but for calls and website clicks, the trends are somewhat more idiosyncratic. In the U.S. and U.K., Retail consumers seem to have resorted to online shopping far more than consumers in Japan and France. Japanese and French consumers' engagement with Retail stayed relatively normal throughout 2020. In recent months, we see this trend reverse as we start to compare post-Covid normal behaviors to peak-Covid behaviors of 2020.
Dive Into Our Search Data
As you can see, there's a lot of data to play with. But why launch a search data hub in the first place?
Well, "our work using AI to transform the search experiences of businesses around the world has given us unparalleled access to search data that [can] help demystify the online customer journey," explains Marc Ferrentino, Chief Strategy Officer at Yext. "Over the last year and a half, businesses across all industries have seen volatile trends in search behavior, making it difficult to measure performance and know how to adjust.
"We hope that by making our search data accessible in this hub, businesses can get a comprehensive understanding of customer behavior in their industry over time, benchmark their performance, and inform their strategy moving forward."
Curious? Click over to the full Yext Data Hubto explore for yourself.