AI Citation Report
Professional Data Visualizations | Q4 2025
Table of Contents
Overview & Aggregate Data
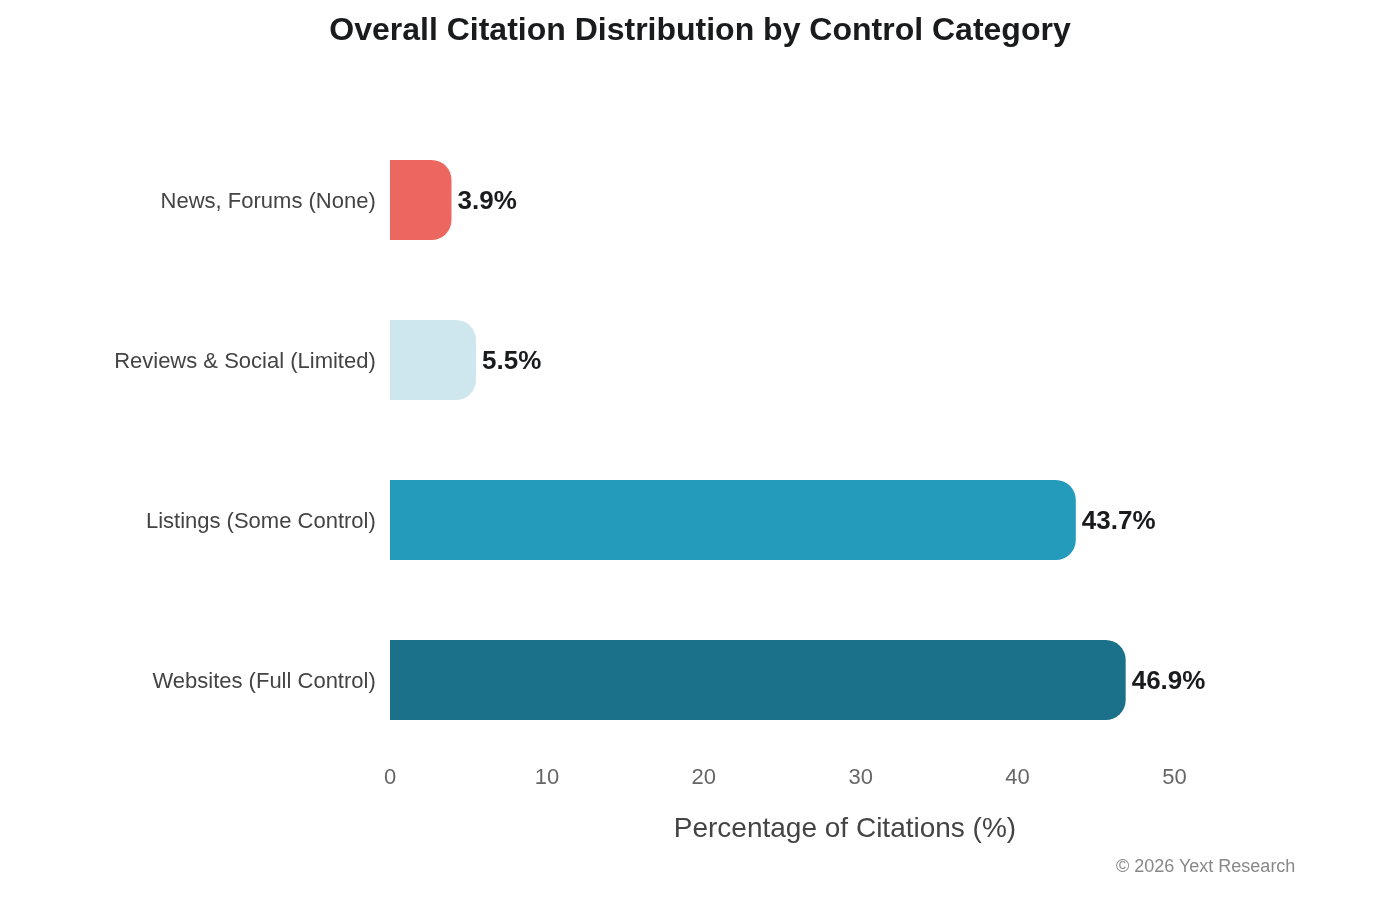
Overall citation distribution shows 46.9% Full Control (websites) and 43.7% Some Control (listings), representing 90.6% controllable citations across all models.
| Control Category | % of Citations |
|---|---|
| Websites (Full Control) | 46.89% |
| Listings (Some Control) | 43.71% |
| Reviews & Social (Limited) | 5.48% |
| News, Forums, Other (None) | 3.92% |
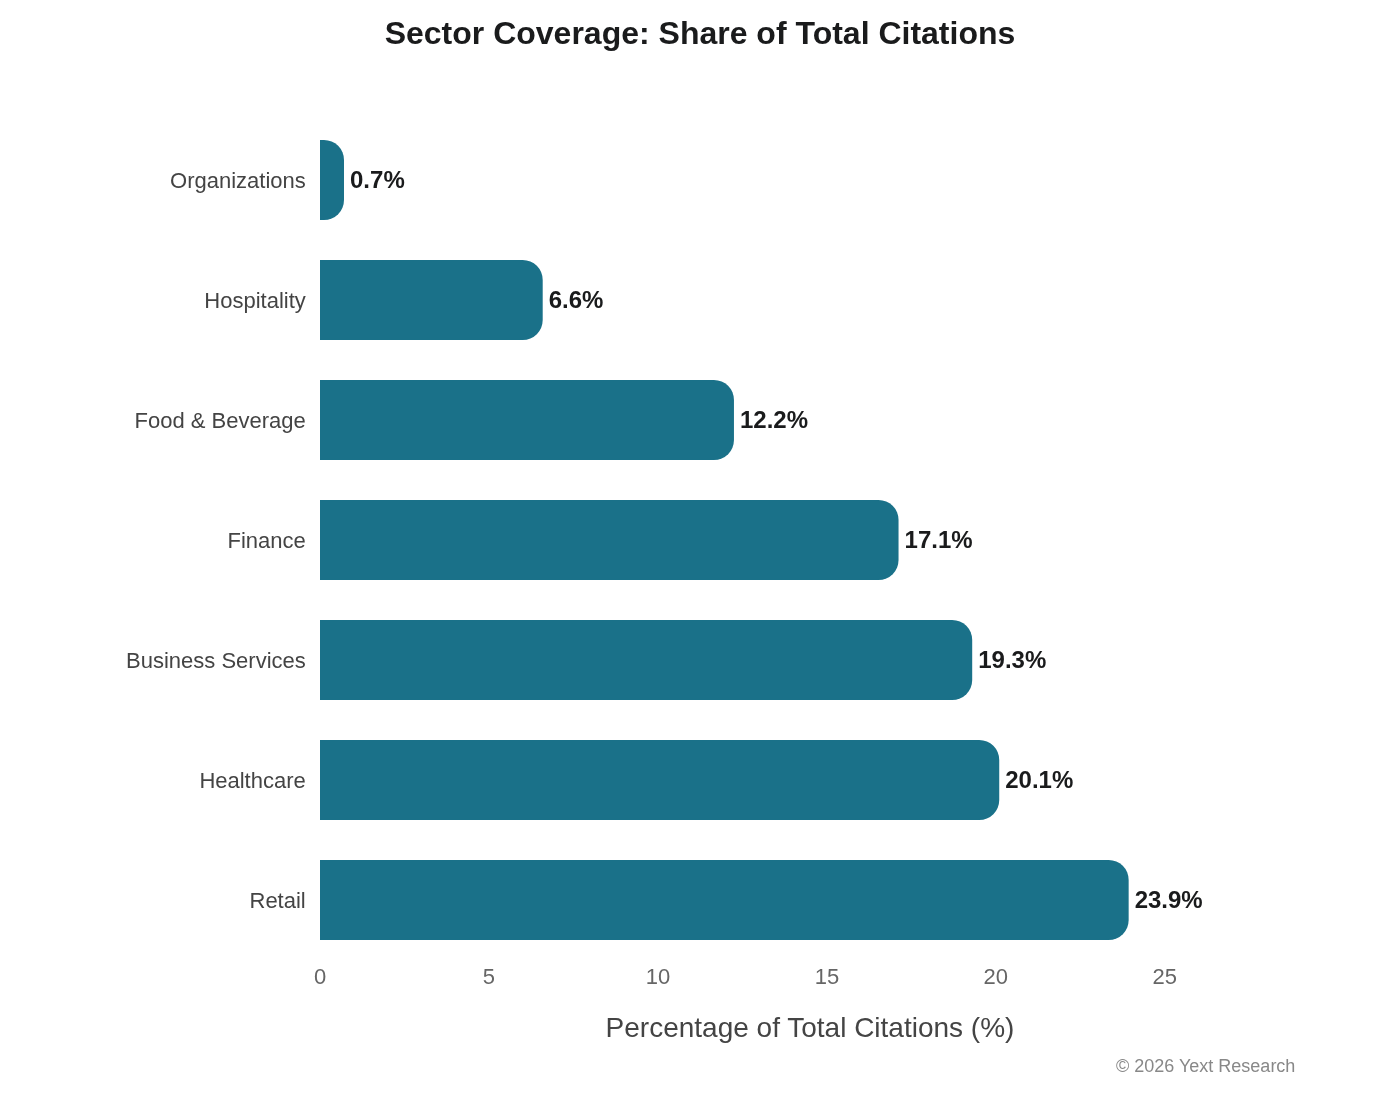
Retail leads with 23.9% of citations, followed by Healthcare (20.1%) and Business Services (19.3%). Organizations represent less than 1% of citations.
| Sector | % of Citations |
|---|---|
| Retail | 23.93% |
| Healthcare | 20.10% |
| Business Services | 19.30% |
| Finance | 17.12% |
| Food & Beverage | 12.25% |
| Hospitality | 6.59% |
| Organizations | 0.71% |
Exhibit 2: The SearchGPT Hospitality Anomaly
SearchGPT's 38.1% Full Control share in Hospitality is roughly double the rate of competing models, representing the largest single-model divergence observed in any sector.
By AI Model
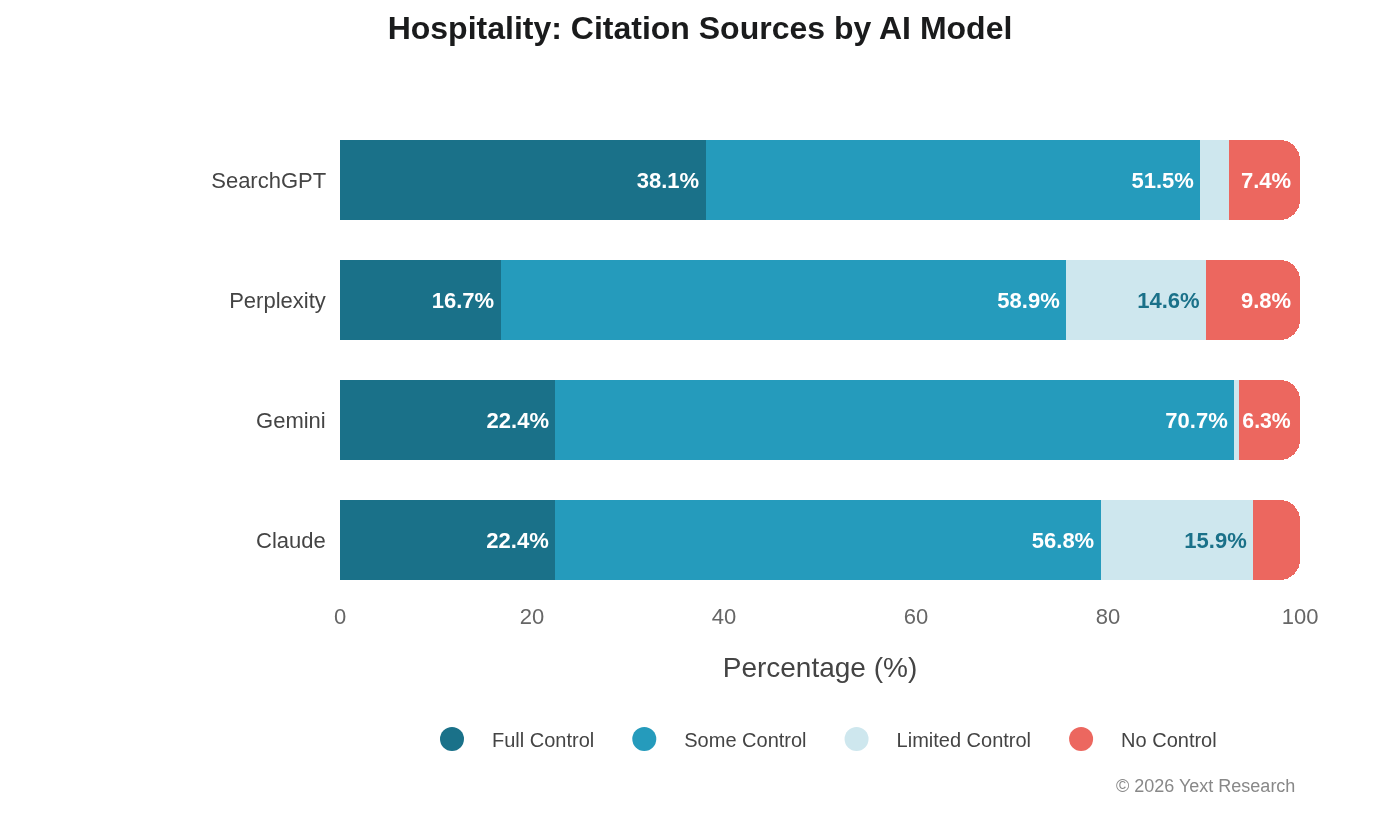
Note SearchGPT's elevated Full Control (38.1%) and Gemini's dominant Some Control (70.7%). Claude shows 15.9% Limited Control, 3x higher than most models.
| Model | Full Control | Some Control | Limited Control | No Control |
|---|---|---|---|---|
| Claude | 22.41% | 56.82% | 15.89% | 4.88% |
| Gemini | 22.44% | 70.70% | 0.52% | 6.34% |
| Perplexity | 16.72% | 58.92% | 14.57% | 9.79% |
| SearchGPT | 38.08% | 51.53% | 2.95% | 7.44% |
Industry Breakdown
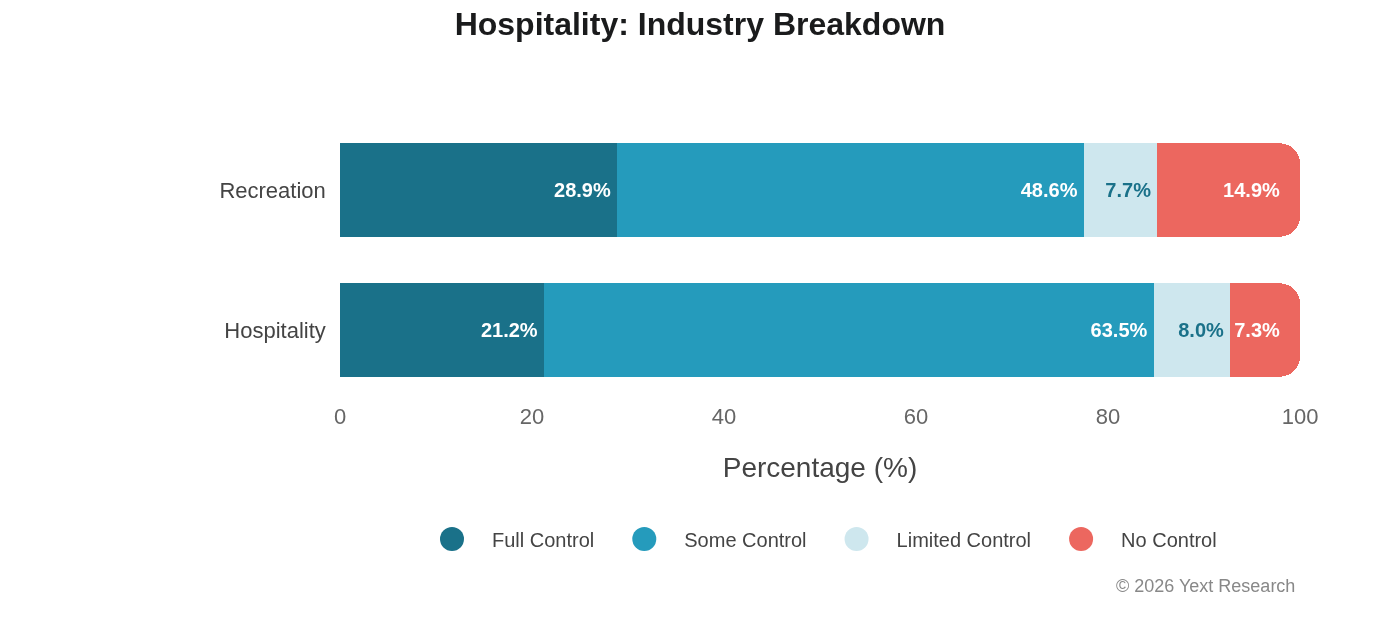
Recreation shows higher Full Control (28.9%) and elevated No Control (14.9%), indicating greater reliance on independent travel publications.
| Industry | Full Control | Some Control | Limited Control | No Control |
|---|---|---|---|---|
| Hospitality | 21.23% | 63.51% | 7.97% | 7.29% |
| Recreation | 28.85% | 48.61% | 7.66% | 14.88% |
Exhibit 3: Business Services
Gemini leads Full Control at 52.15%, while Claude's Limited Control dependency (15.89%) is more than double any other model.
By AI Model
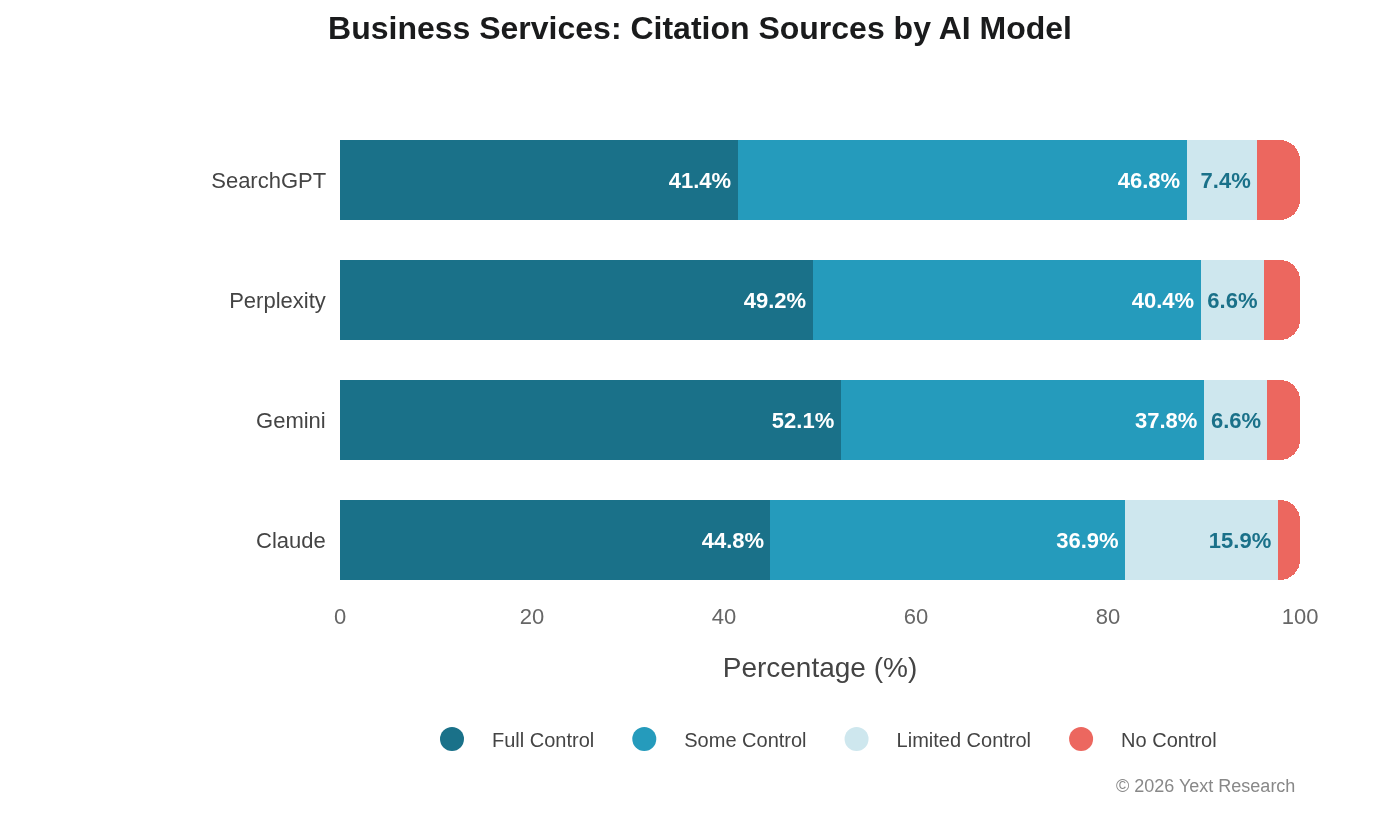
Clear model differentiation with Gemini favoring first-party websites and Claude drawing heavily from reviews and social content.
| Model | Full Control | Some Control | Limited Control | No Control |
|---|---|---|---|---|
| Claude | 44.84% | 36.94% | 15.89% | 2.33% |
| Gemini | 52.15% | 37.82% | 6.64% | 3.39% |
| Perplexity | 49.22% | 40.42% | 6.60% | 3.76% |
| SearchGPT | 41.41% | 46.77% | 7.36% | 4.45% |
Industry Breakdown
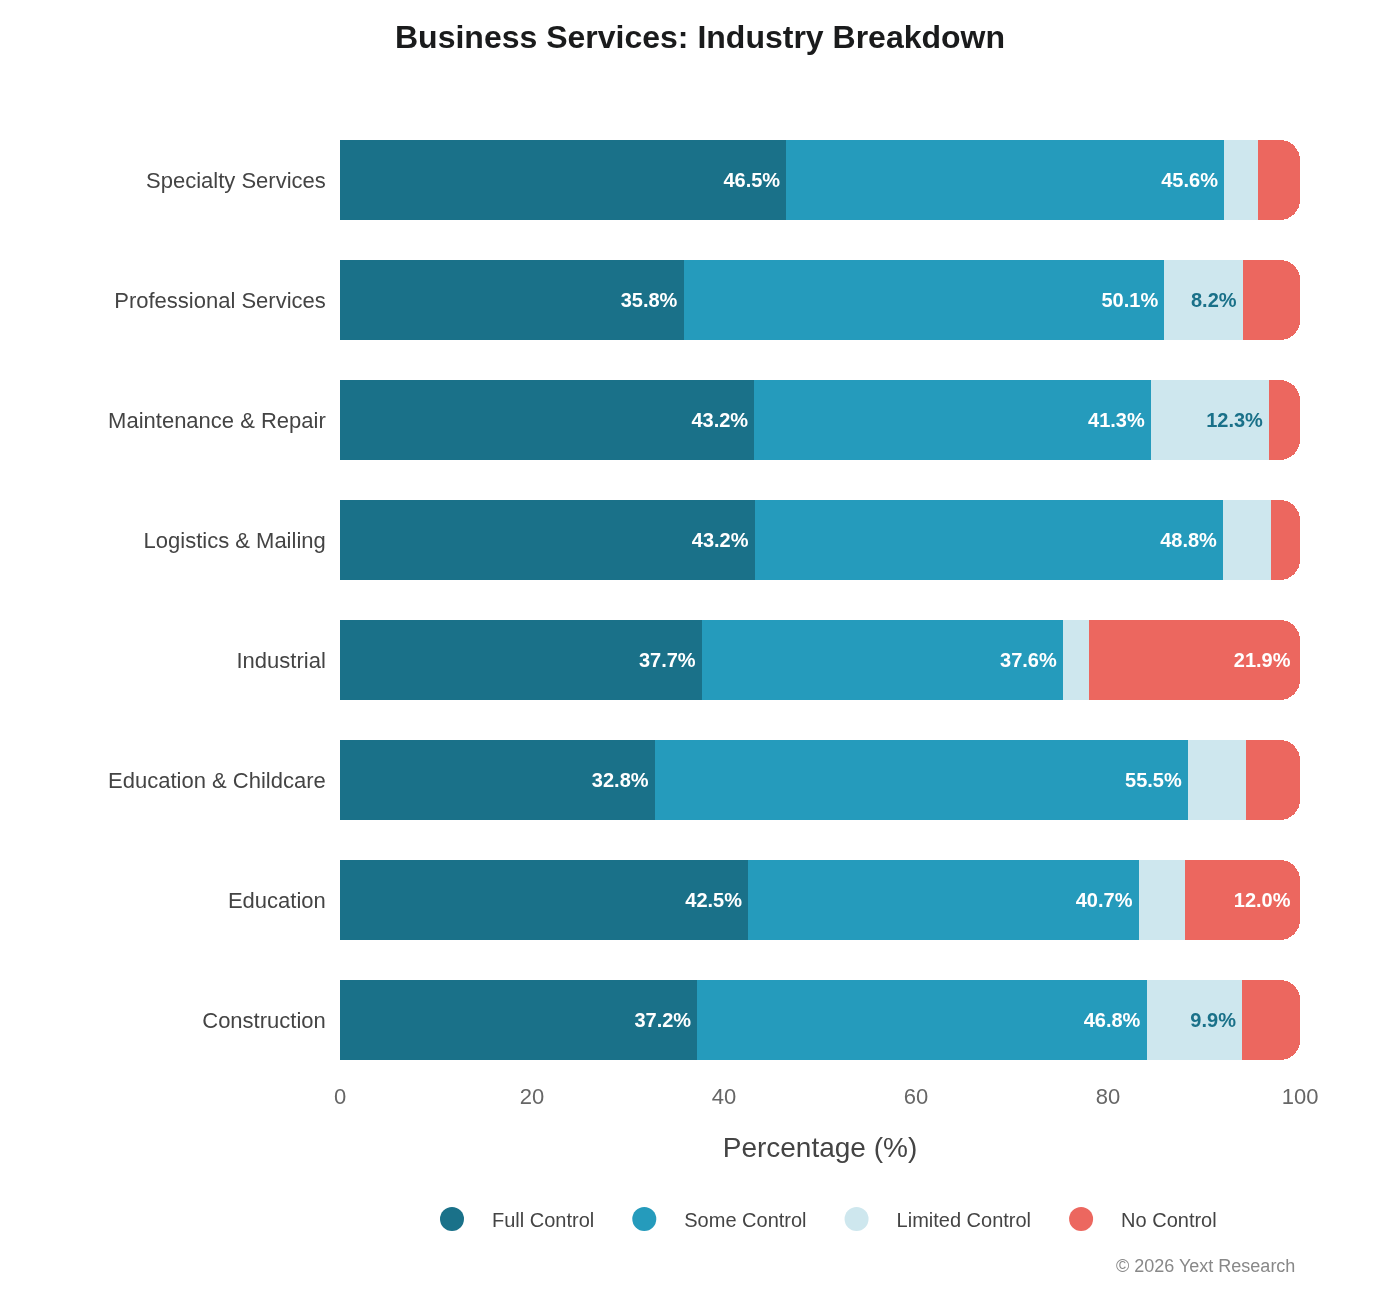
Maintenance & Repair shows elevated Limited Control (12.31%), reflecting the importance of review platforms like Yelp and Angi.
| Industry | Full Control | Some Control | Limited Control | No Control |
|---|---|---|---|---|
| Construction | 37.22% | 46.80% | 9.95% | 6.04% |
| Education | 42.52% | 40.67% | 4.80% | 12.01% |
| Education & Childcare | 32.79% | 55.54% | 6.00% | 5.67% |
| Industrial | 37.69% | 37.62% | 2.76% | 21.93% |
| Logistics & Mailing | 43.20% | 48.79% | 4.98% | 3.03% |
| Maintenance & Repair | 43.16% | 41.31% | 12.31% | 3.21% |
| Professional Services | 35.79% | 50.08% | 8.17% | 5.97% |
| Specialty Services | 46.49% | 45.61% | 3.51% | 4.39% |
Exhibit 4: Finance
Strong Some Control preference across all models, driven by financial directories and comparison platforms. Gemini leads Full Control at 51.62%.
By AI Model
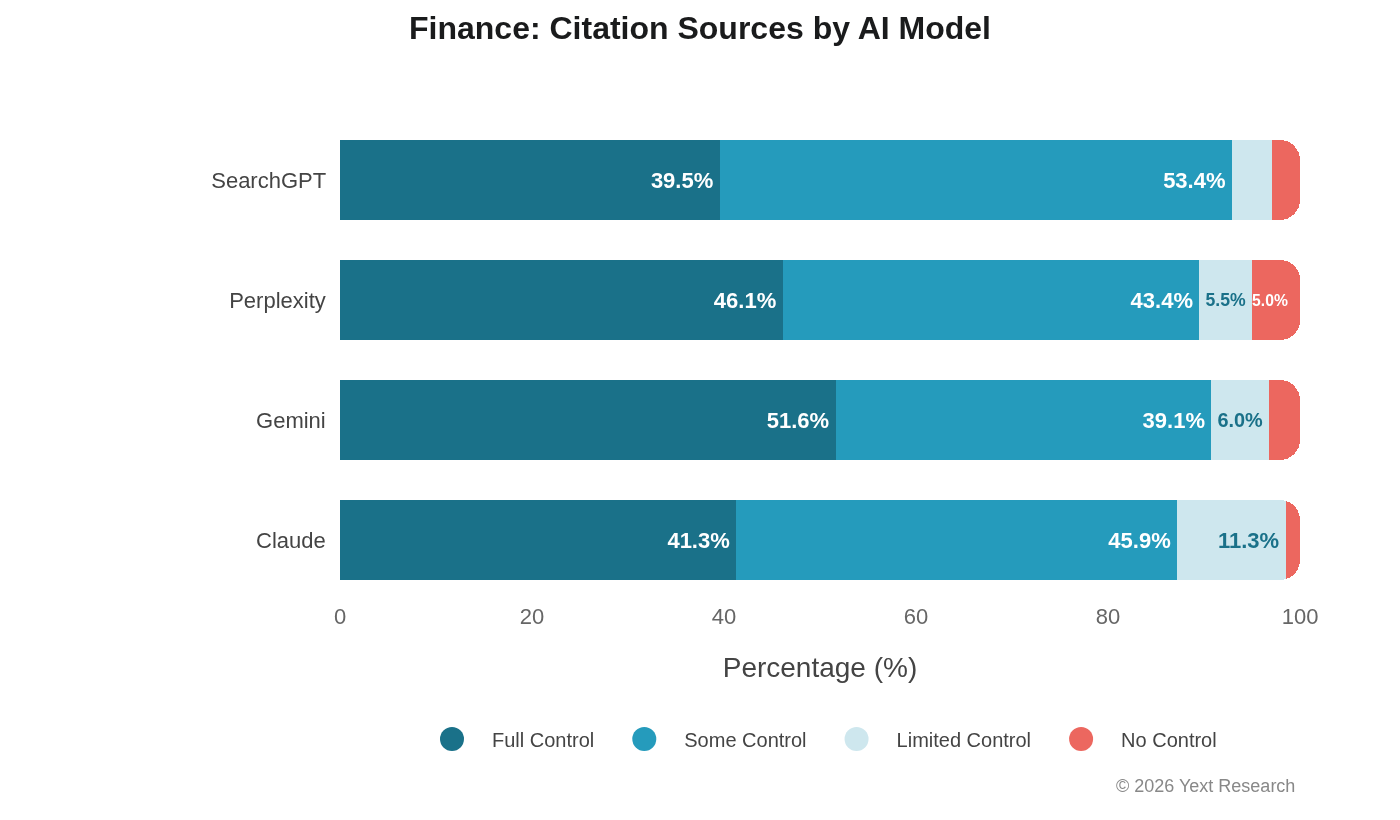
All models show balanced citation patterns between Full and Some Control, with relatively low Limited Control rates (1.5-11.3%).
| Model | Full Control | Some Control | Limited Control | No Control |
|---|---|---|---|---|
| Claude | 41.27% | 45.93% | 11.30% | 1.50% |
| Gemini | 51.62% | 39.15% | 6.01% | 3.22% |
| Perplexity | 46.11% | 43.41% | 5.48% | 5.01% |
| SearchGPT | 39.55% | 53.36% | 4.17% | 2.92% |
Industry Breakdown
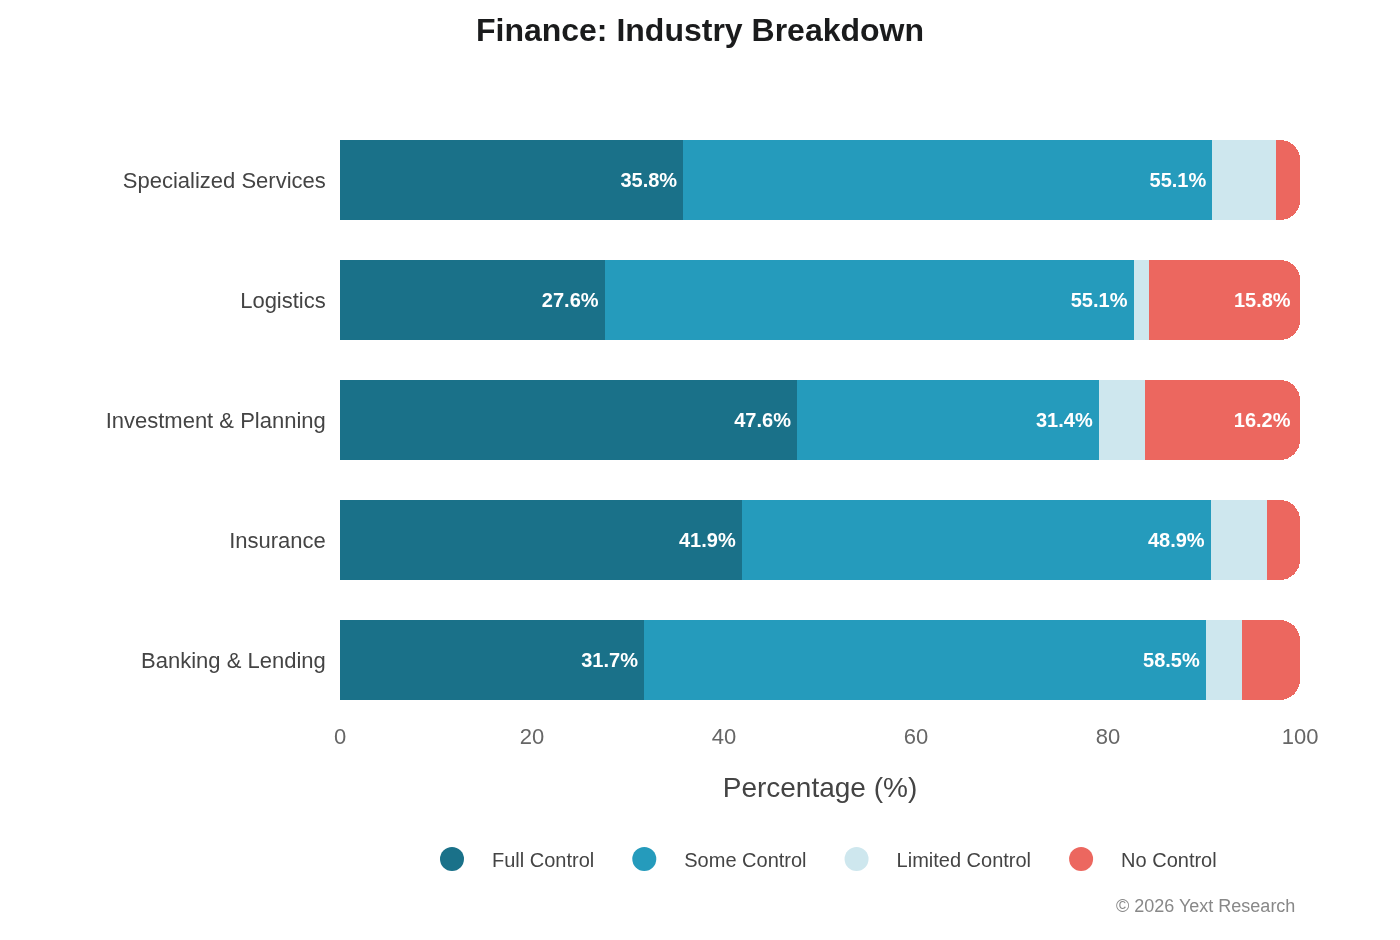
Banking & Lending shows highest Some Control (58.52%), indicating heavy reliance on financial directories and comparison sites.
| Industry | Full Control | Some Control | Limited Control | No Control |
|---|---|---|---|---|
| Banking & Lending | 31.68% | 58.52% | 3.75% | 6.04% |
| Insurance | 41.86% | 48.85% | 5.80% | 3.49% |
| Investment & Planning | 47.62% | 31.43% | 4.76% | 16.19% |
| Logistics | 27.58% | 55.09% | 1.56% | 15.78% |
| Specialized Services | 35.76% | 55.12% | 6.58% | 2.55% |
Exhibit 5: Healthcare
Healthcare shows the narrowest model divergence of any sector, with Full Control ranging from 34.6% to 40.5%–a span of less than 6 percentage points.
By AI Model
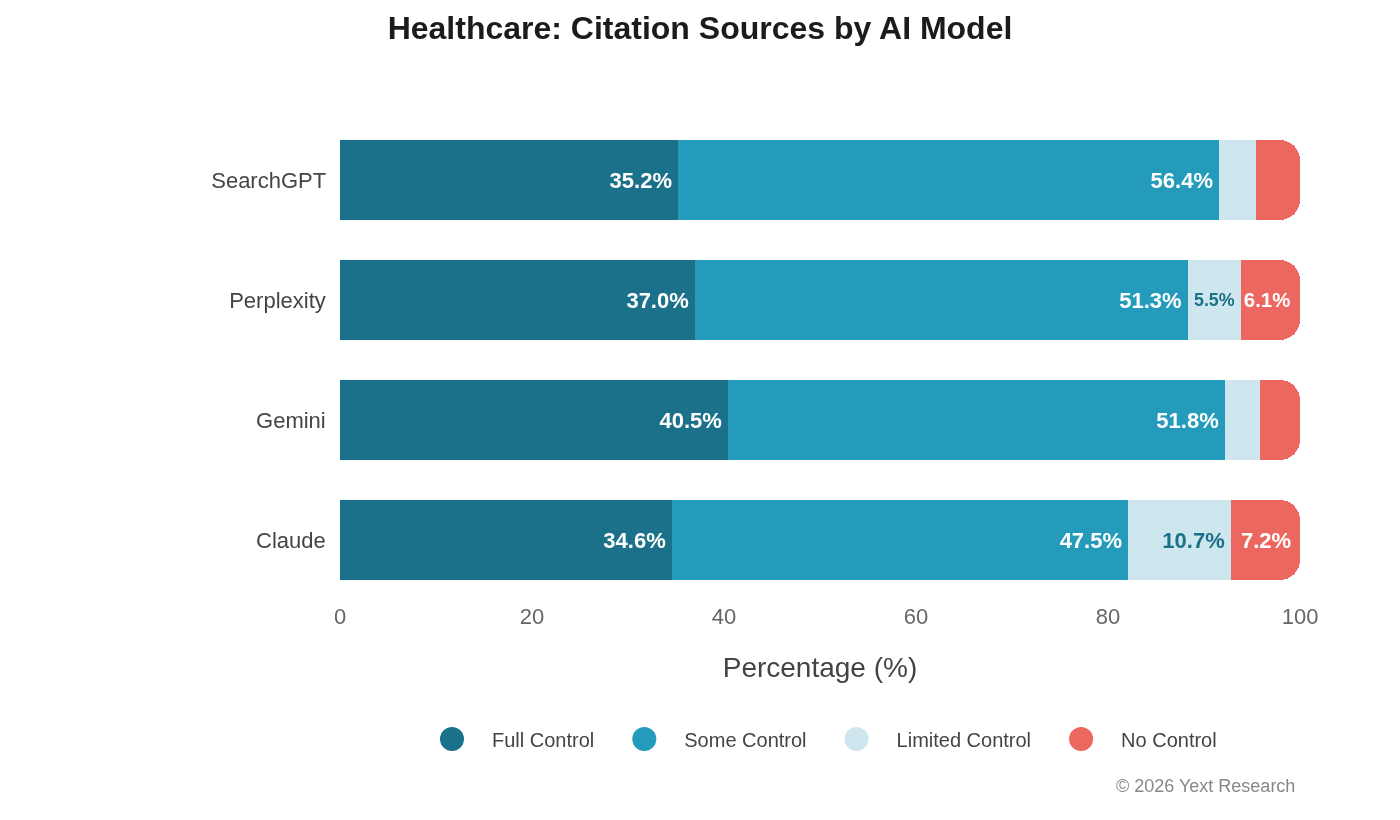
Unusual model convergence suggests shared sensitivity to medical information accuracy or structural dominance of healthcare directory platforms.
| Model | Full Control | Some Control | Limited Control | No Control |
|---|---|---|---|---|
| Claude | 34.60% | 47.53% | 10.70% | 7.17% |
| Gemini | 40.45% | 51.75% | 3.66% | 4.14% |
| Perplexity | 37.00% | 51.33% | 5.52% | 6.14% |
| SearchGPT | 35.25% | 56.35% | 3.81% | 4.58% |
Industry Breakdown
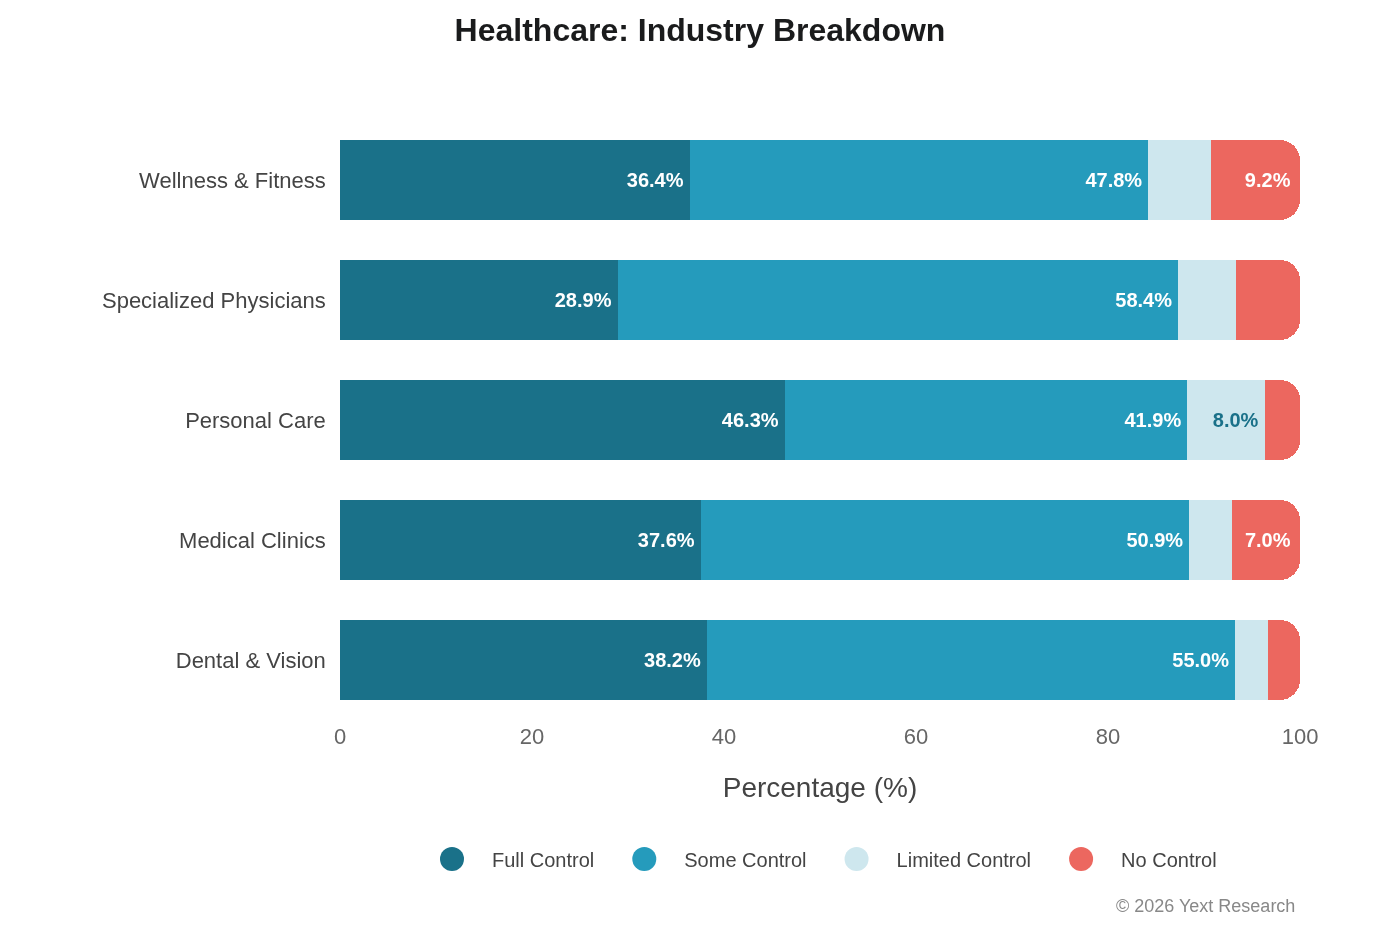
Specialized Physicians show highest Some Control (58.39%), indicating the centrality of healthcare directories for specialist discovery.
| Industry | Full Control | Some Control | Limited Control | No Control |
|---|---|---|---|---|
| Dental & Vision | 38.22% | 55.03% | 3.46% | 3.29% |
| Medical Clinics | 37.58% | 50.89% | 4.48% | 7.05% |
| Personal Care | 46.33% | 41.94% | 8.04% | 3.70% |
| Specialized Physicians | 28.92% | 58.39% | 6.04% | 6.65% |
| Wellness & Fitness | 36.43% | 47.77% | 6.54% | 9.25% |
Exhibit 6: Food & Beverage
This is where Claude's Limited Control dependency is most pronounced: 24.35% vs. Gemini's 2.57%, a nearly 10x difference.
By AI Model
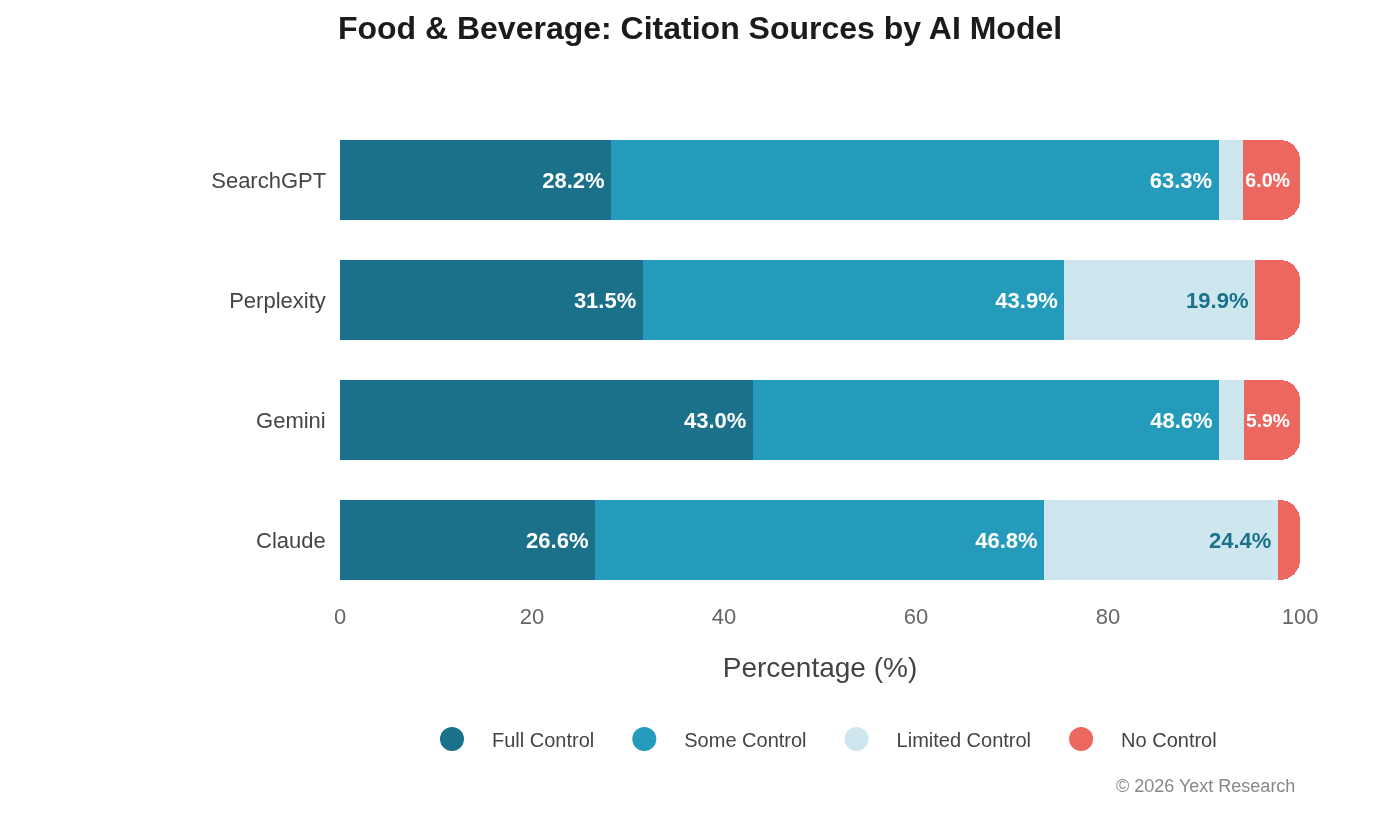
Ask Claude about a restaurant and roughly one in four citations will be a review or social media post. Ask Gemini and that ratio drops to one in forty.
| Model | Full Control | Some Control | Limited Control | No Control |
|---|---|---|---|---|
| Claude | 26.55% | 46.78% | 24.35% | 2.32% |
| Gemini | 43.00% | 48.56% | 2.57% | 5.87% |
| Perplexity | 31.53% | 43.90% | 19.87% | 4.70% |
| SearchGPT | 28.23% | 63.28% | 2.54% | 5.95% |
Industry Breakdown
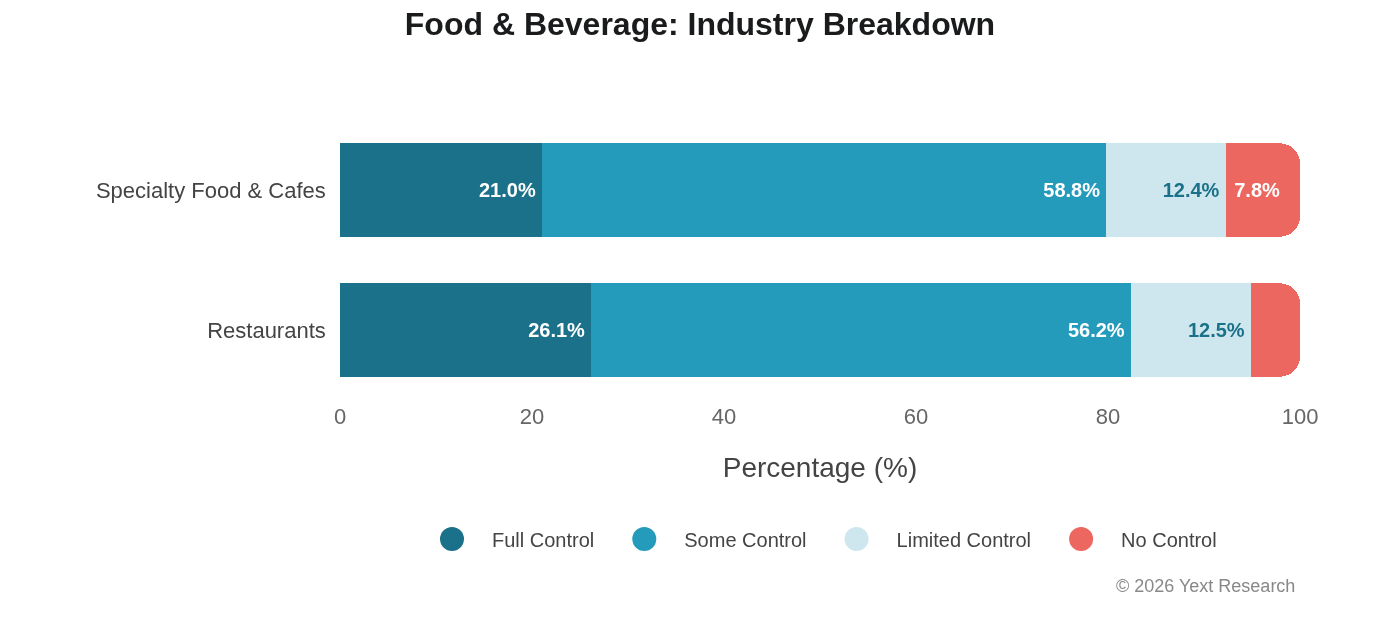
Both Restaurants and Specialty Food & Cafes show similar Limited Control levels (~12.5%), but cafes have higher No Control, indicating greater reliance on food blogs.
| Industry | Full Control | Some Control | Limited Control | No Control |
|---|---|---|---|---|
| Restaurants | 26.15% | 56.23% | 12.50% | 5.12% |
| Specialty Food & Cafes | 21.03% | 58.78% | 12.44% | 7.75% |
Exhibit 7: Retail
Moderate variation across models with relatively balanced citation distribution. All models show strong Some Control preference (49-58%).
By AI Model
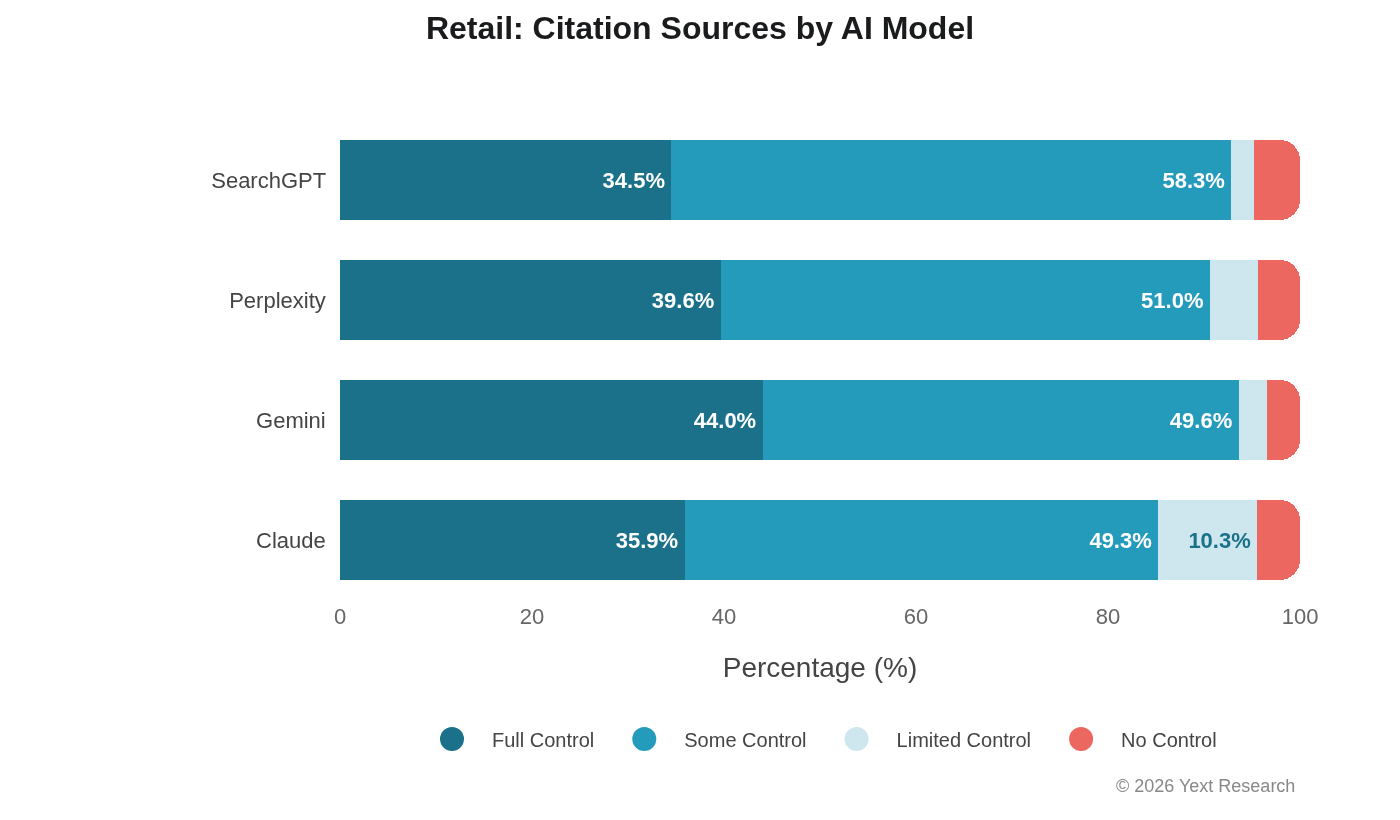
Consistent pattern across models with Some Control dominant, though Claude maintains elevated Limited Control at 10.31%.
| Model | Full Control | Some Control | Limited Control | No Control |
|---|---|---|---|---|
| Claude | 35.89% | 49.34% | 10.31% | 4.46% |
| Gemini | 44.02% | 49.59% | 2.91% | 3.48% |
| Perplexity | 39.65% | 50.96% | 4.98% | 4.41% |
| SearchGPT | 34.52% | 58.32% | 2.36% | 4.80% |
Industry Breakdown
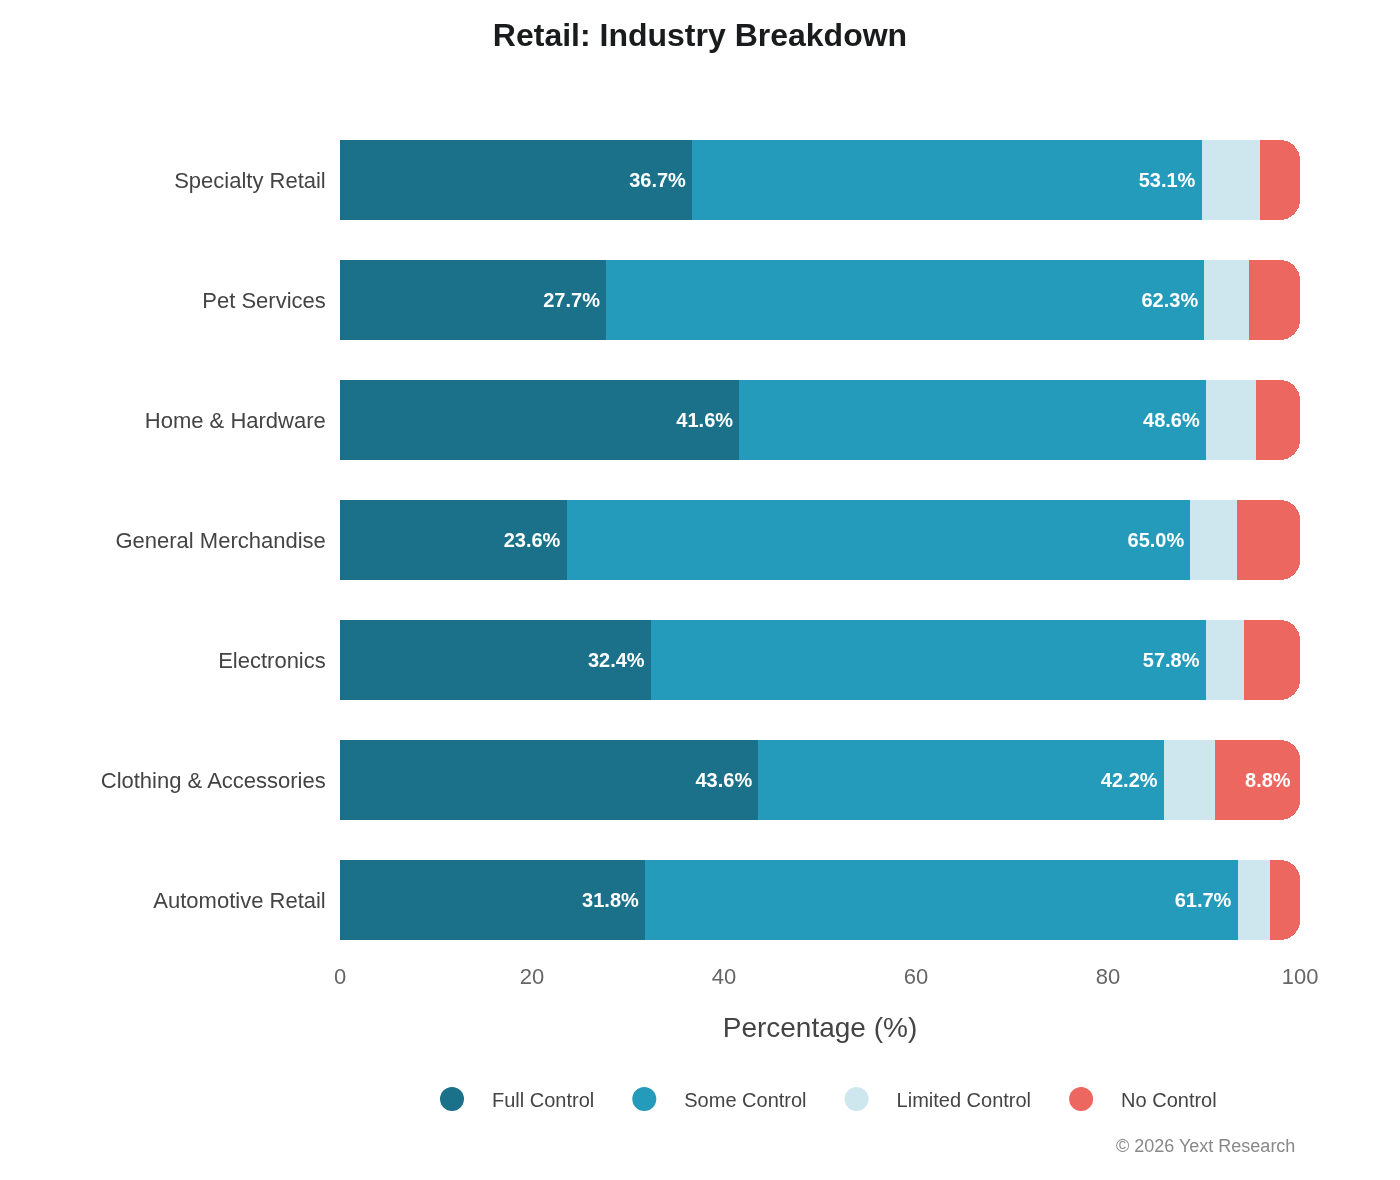
General Merchandise shows highest Some Control (64.99%) and lowest Full Control (23.60%), suggesting heavy reliance on aggregators and comparison sites.
| Industry | Full Control | Some Control | Limited Control | No Control |
|---|---|---|---|---|
| Automotive Retail | 31.77% | 61.73% | 3.39% | 3.12% |
| Clothing & Accessories | 43.58% | 42.23% | 5.38% | 8.82% |
| Electronics | 32.38% | 57.80% | 4.03% | 5.79% |
| General Merchandise | 23.60% | 64.99% | 4.81% | 6.61% |
| Home & Hardware | 41.59% | 48.61% | 5.19% | 4.61% |
| Pet Services | 27.72% | 62.32% | 4.62% | 5.34% |
| Specialty Retail | 36.67% | 53.08% | 6.04% | 4.21% |
Exhibit 8: Organizations
Organizations (non-profits and religious institutions) show uniquely high No Control rates (12-19%), far higher than other sectors.
By AI Model
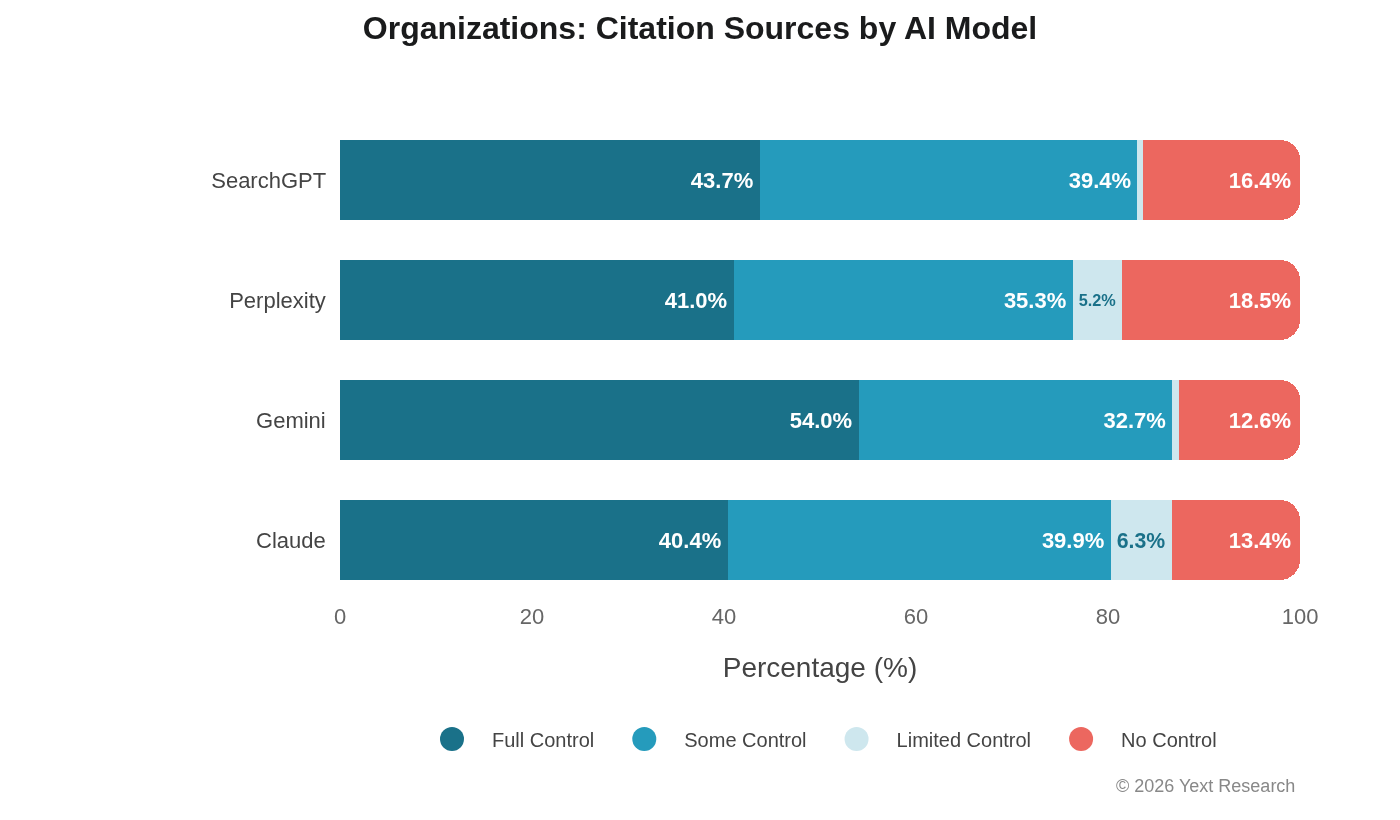
Elevated No Control across all models reflects that non-profits and religious organizations are written about in news coverage and community publications more than they produce discoverable content.
| Model | Full Control | Some Control | Limited Control | No Control |
|---|---|---|---|---|
| Claude | 40.38% | 39.90% | 6.34% | 13.38% |
| Gemini | 54.01% | 32.69% | 0.73% | 12.58% |
| Perplexity | 40.99% | 35.33% | 5.15% | 18.53% |
| SearchGPT | 43.71% | 39.36% | 0.54% | 16.40% |
Industry Breakdown
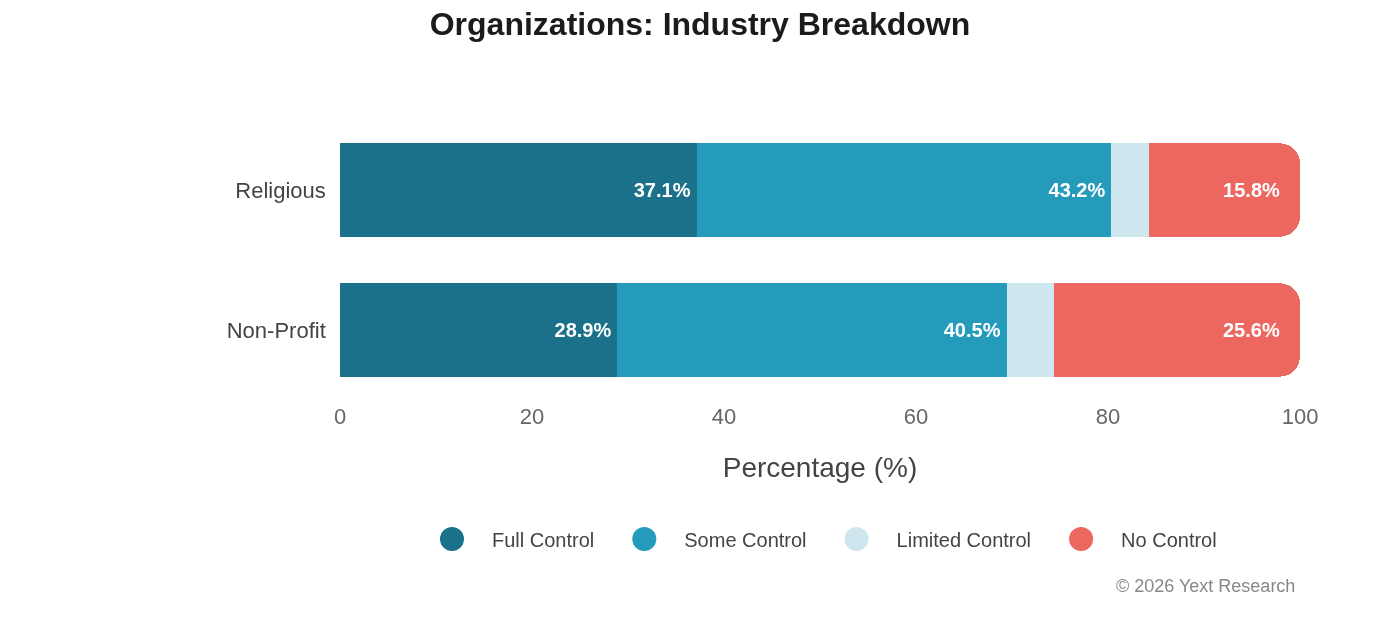
Non-profits show remarkable 25.62% No Control rate. For these organizations, AI search visibility is substantially determined by what others write about them.
| Industry | Full Control | Some Control | Limited Control | No Control |
|---|---|---|---|---|
| Non-Profit | 28.90% | 40.54% | 4.93% | 25.62% |
| Religious | 37.15% | 43.21% | 3.87% | 15.77% |
Exhibit 9: Claude's Limited Control Dependency
Claude's elevated Limited Control reliance is the most consistent cross-sector pattern in the data. In all seven sectors, Claude leads Limited Control citation share.
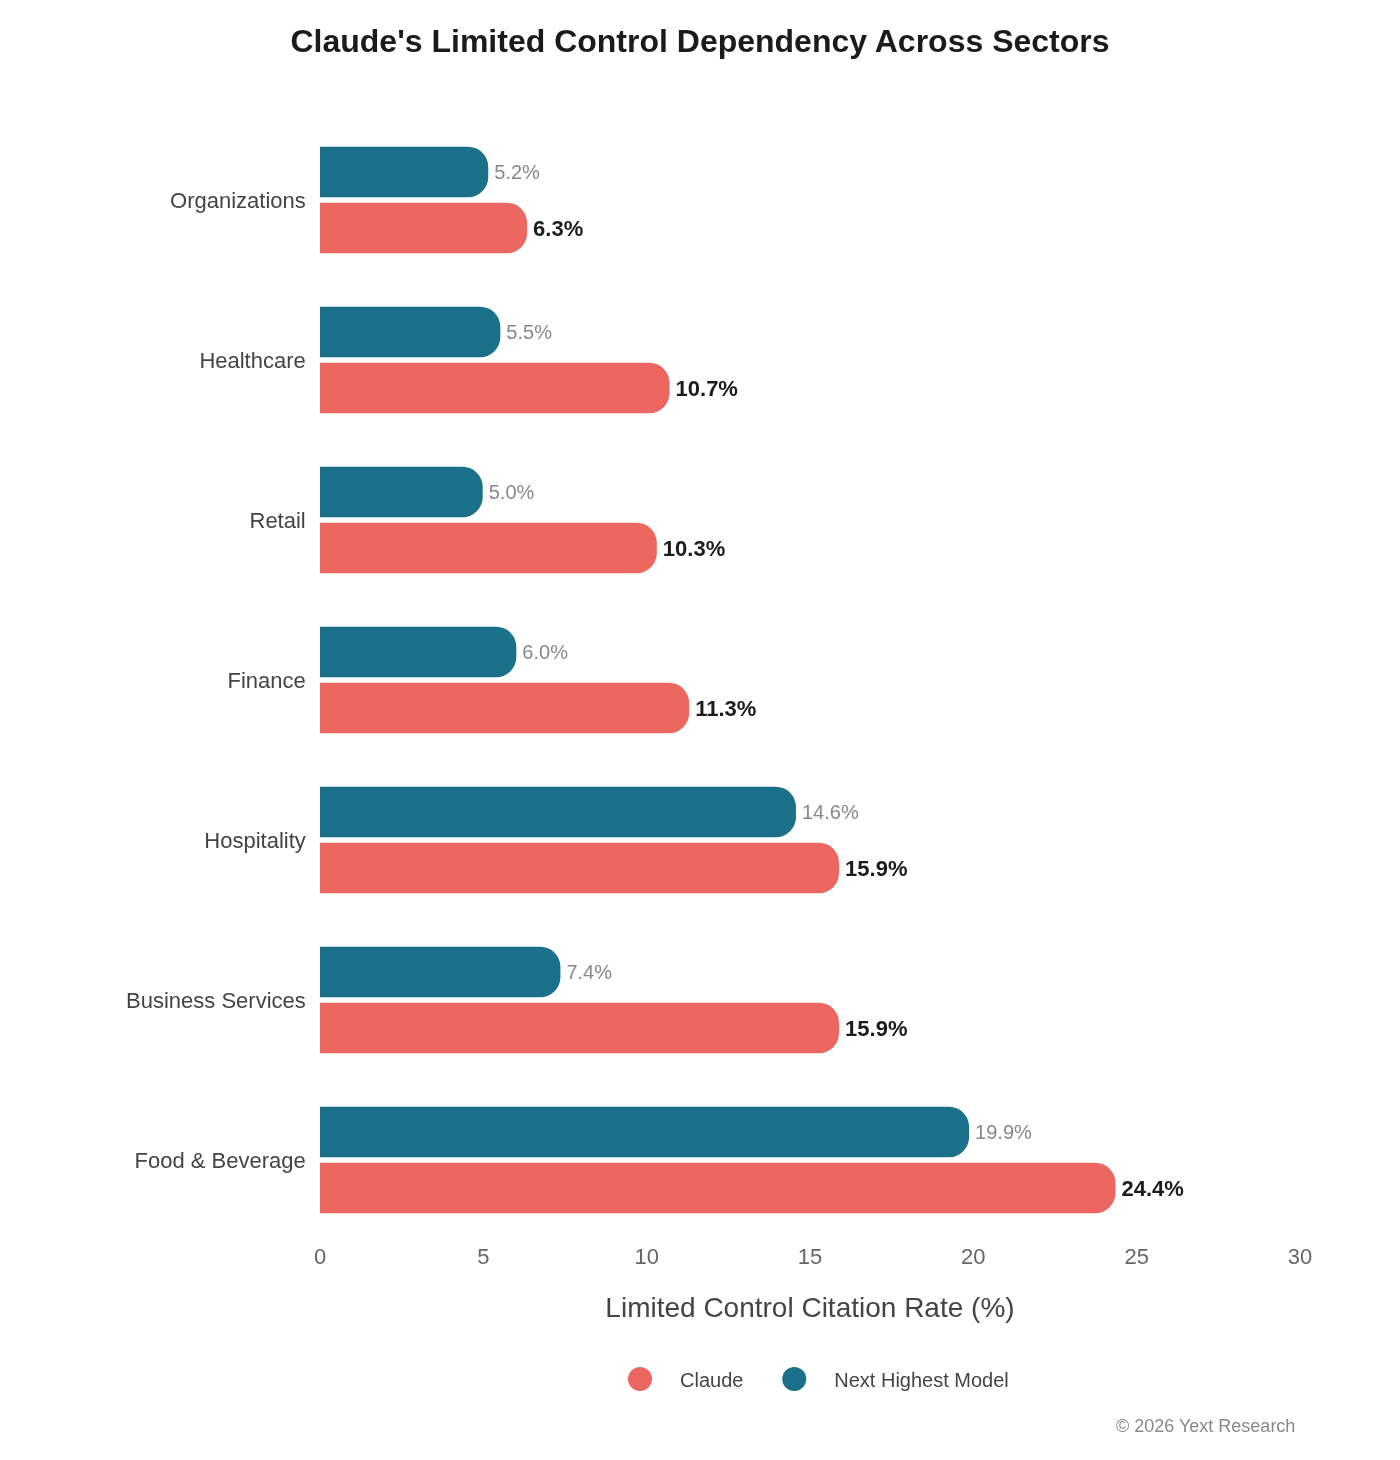
No other model shows this kind of directional consistency on any single metric. The gap ranges from +1.19 pp (Organizations) to +8.53 pp (Business Services).
| Sector | Claude | Next Highest | Gap |
|---|---|---|---|
| Food & Beverage | 24.35% | 19.87% | +4.48 pp |
| Business Services | 15.89% | 7.36% | +8.53 pp |
| Hospitality | 15.89% | 14.57% | +1.32 pp |
| Finance | 11.30% | 6.01% | +5.29 pp |
| Retail | 10.31% | 4.98% | +5.33 pp |
| Healthcare | 10.70% | 5.52% | +5.18 pp |
| Organizations | 6.34% | 5.15% | +1.19 pp |
Exhibit 10: Sector-Level Summary
Key patterns and outliers identified across all seven sectors.
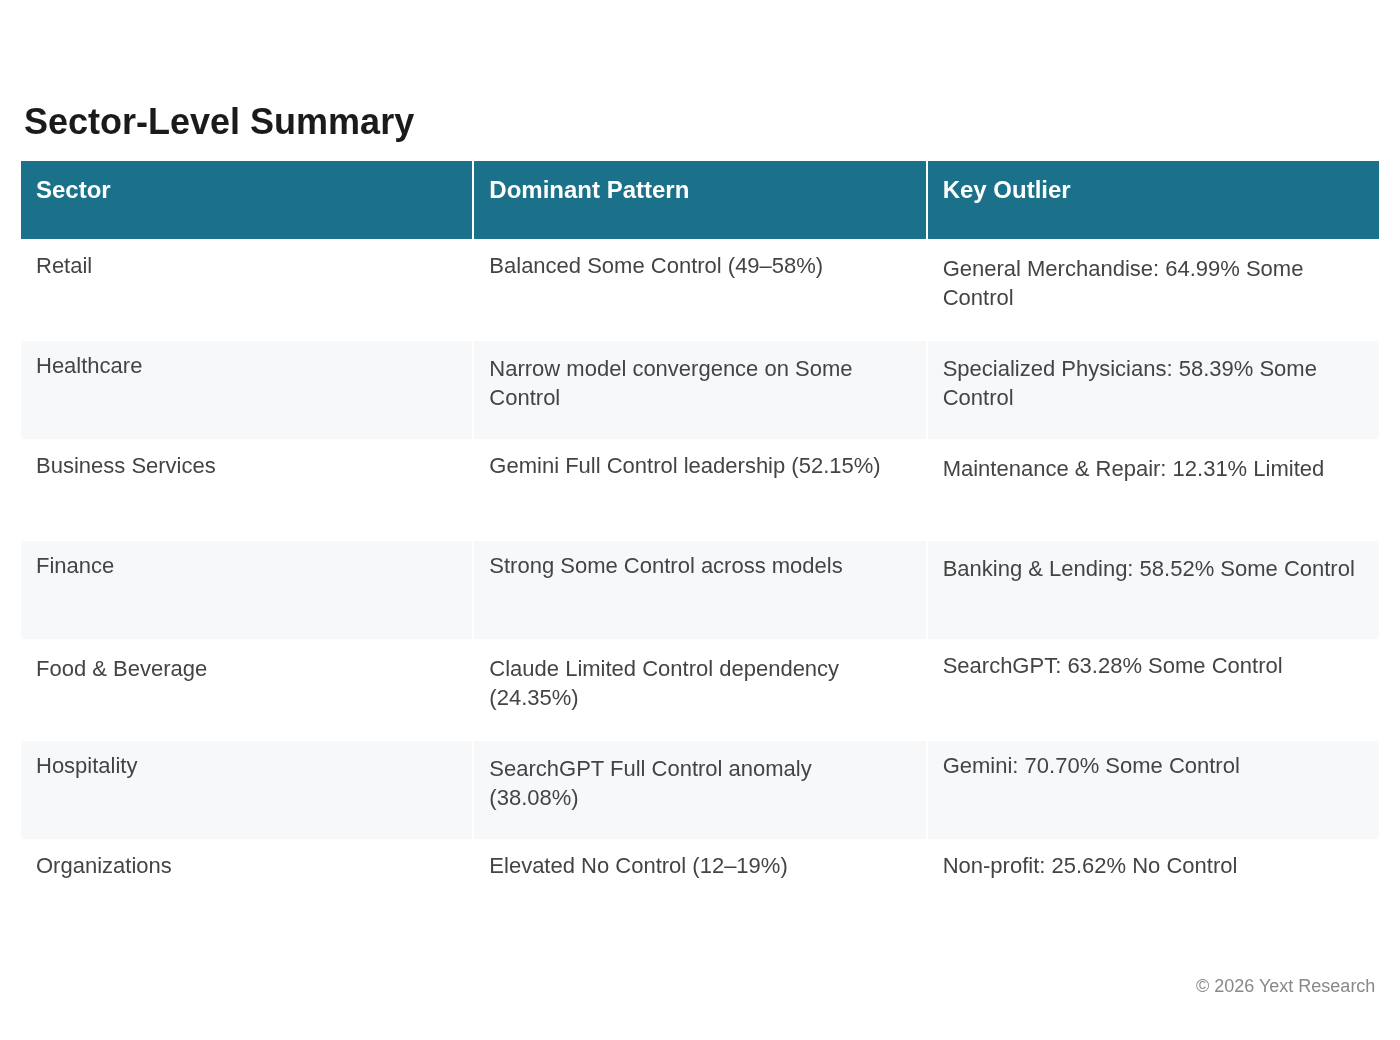
Citation patterns vary more within sectors than across them. Each sector has distinct dynamics that affect model behavior.