Building a Monthly Digital Brand Visibility Observatory
Background and methods for collecting 2 billion monthly data points for the Scout Index
Aug 4, 2025
Abstract
The Scout Index is a large-scale, time-based observatory developed by Yext Research to measure and interpret digital visibility across local search environments. Designed to help marketers and SEO professionals understand not just who appears in search results but also why, the Scout Index collects over 2 billion monthly data points across 2,500 U.S. ZIP codes and more than 100 vertical-specific keyword queries. This system extends beyond conventional SERP tracking by evaluating business listings, website construction, technical SEO, social, and review ecosystems, enabling a holistic understanding of brand visibility. Scout's methodology segments over 9 million business-location pairs by region, category, and keyword, offering a rare opportunity to analyze how search algorithms interpret, connect, and prioritize content based on real-world user behavior. By mapping semantic relationships between keywords and Google categories, the Index reveals deeper algorithmic patterns — insights that can be leveraged for more efficient keyword targeting, improved ad performance, and increased AI-generated citations in platforms. As AI-driven discovery replaces traditional ranking models, the Scout Index serves as an evolving framework for understanding the underlying signals that govern visibility in a fragmented and increasingly agentic web. This research lays a foundation for studying the architecture of search as AI matures.
Introduction
Yext Research is a new initiative from Yext to help marketers and SEO leaders understand what's changing and why it matters. This new initiative highlights the observable signals that influence how brands are discovered and trusted across search, listings, reviews, social, and AI-generated experiences. The bread and butter of Yext Research is the Scout Index. The Scout Index is a time-based observatory offering a unique and rare view into the behaviors and outcomes of local search. It provides an expansive and highly detailed perspective on brand visibility performance across a diverse range of geographical and economic regions. What truly differentiates the Scout Index from other analytical tools is its reach beyond tracking local SERP and rank. This new index presents a unique opportunity for us to observe search results through the eyes of an everyday user when they search for a topic related to any of our defined keywords. We achieve this by running each search at the local level (ZIP codes) to create a baseline series of metrics that more accurately reflect what an individual in that area will find in search, whether in Google or AI. However, the real power of the Scout Index lies in its wide field of view. With each location analyzed, the Scout Index identifies the 40 top competitors for every keyword-location pair. We also collect information on the wider digital footprint for each of these businesses. These scans encompass their website construction, content, and technical SEO. Next, we analyze their review profiles across various platforms, assessing sentiment, frequency, and response strategies. Our multi-faceted scanning process collects over 200 distinct data points for every single location within its scope. Scaling that out yields more than 2 billion data points per month. This rich dataset empowers us with profound insights into the competitive landscape, user behavior, and the ever-evolving dynamics of brand visibility.
Constructing the Scout Index
Keyword selection
The origin of any search query is a user's intent, which translates to keywords in classic search. For our core keyword selection, we examined our existing customers and derived millions of keywords from the categories they had selected when configuring their Google Business Profile. We then created logical groups of industries (verticals) based on the keywords and their meanings (see Table 1).
Please note that our current analysis provides only a broad overview of Professional Services due to the diversity of business and location types. We plan to explore this and additional groupings in the future.
Table 1: Industry verticals and included keywords
| Industry | Keyword | Count |
|---|---|---|
| Financial Services | "auto insurance", "banks", "business banking", "car loan", "financial advisors", "financial planner", "home insurance", "insurance agency", "life insurance", "loan agency", "mortgage lenders", "motorcycle insurance", "renter's insurance", "tax services" | 14 |
| Food Service | "bars", "catering", "coffee shop", "fast food", "food delivery service", "grocery store", "restaurants" | 7 |
| Healthcare | "alternative medicine", "clinic", "dentist", "doctor", "eye care", "mental health clinic", "pediatric medicine", "pharmacy", "physical therapy", "radiology" | 10 |
| Travel | "hotel", "travel agency" | 2 |
| Other | "apartments", "churches", "day care center", "fitness center", "funeral home", "government office", "internet provider", "learning centers", "manufacturing", "non-profit organization", "nursing home", "wedding venues" | 12 |
| Professional Services | "auto body shop", "auto repair", "commercial cleaning service", "computer repair", "concrete contractor", "criminal lawyer", "electrician", "facilities management", "family lawyer", "general contractor", , "hair salon", "house cleaning service", , "HVAC repair", "internet marketing services", "kitchen remodeling", "landscaping service", "lawyers", "limo services", "moving company", "painting service", "personal injury lawyer", "pet services", "photography services", "plumbers", "real estate agent", "roofing contractor", "shipping service", "spa services", "veterinarian", "window installers" | 30 |
| Retail | "appliance store", "auto parts", "bedding store", "bike shop", "car dealership", "car rental", "clothing store", "copy shop", "cosmetics store", "electronics store", "flooring stores", "florist", "furniture store", "gas station", "gift shop", "hardware store", "jewelry store", "music store", "pet store", "self storage", "shoe store", "shopping", "vitamin store", "wine store", "wireless store" | 25 |
Table 1 - These are the 100 keywords based on our brand visibility business analysis. These are then divided into seven vertical categories, allowing for easy evaluation by industry.
Table 2: Industries and category counts
| Industry | Google Keywords | Primary Categories | Secondary Categories | Total Businesses | Total Locations | ZIP Codes |
|---|---|---|---|---|---|---|
| Financial Services | 14 | 277 | 925 | 109,854 | 170,393 | 10,549 |
| Food Service | 7 | 737 | 1,642 | 100,683 | 197,364 | 10,668 |
| Healthcare | 10 | 539 | 1,268 | 149,712 | 183,599 | 10,184 |
| Hospitality | 2 | 234 | 851 | 27,996 | 28,777 | 6,290 |
| Other | 12 | 1,313 | 2,600 | 127,745 | 156,068 | 13,057 |
| Professional Services | 30 | 1,202 | 2,716 | 462,166 | 524,979 | 13,681 |
| Retail | 25 | 1,586 | 2,926 | 169,848 | 353,328 | 14,532 |
| 100 | 5,888 | 12,928 | 1,148,004 | 1,614,508 | 78,961 |
Table 2 - From the Keywords (see Table 1), we then retrieve the Primary and Secondary Categories from each return location's Google Business Profile.
Local brand visibility
The central feature of this dataset is localized scanning, and to do this, we sought to strike a balance between population diversity, cost, and rationality. To achieve this, we selected the 2,500 most populated U.S. Postal Codes (ZIP Codes). This provides us with an acceptable cross-section of regionality and diversity. We did exclude outlying U.S. Territories for the time being.
This method covers every U.S. ZIP Code with a population of at least 36,652.
Figure 1 - Map of the United States and the number of Postal Codes (ZIP Codes) scanned in each state.
Putting the scan into action, it detects approximately 2.7 million unique business names and Google Place ID combinations. However, because many businesses appear in multiple ZIP codes, we expanded the scope to capture businesses returned in the search results beyond the ZIP code of origin. This yielded just over 9.4 million locations. This approach enables researchers to understand local search behavior near the business and how brand strength extends across distances.
From the 100 keywords scanned in each ZIP Code, we retrieve the top 40 results and the Primary and Secondary Google Categories from those results.
Figure 2 - Geographic Distribution of Businesses in the Scout Index, highlighting instances of inaccurate metadata leading to erroneous coastal placements.
Putting the Scout Index to work
The scale of this monthly scan will allow researchers to conduct highly detailed evaluations, identify emerging trends, and provide unparalleled insights into markets and consumer behavior. For instance, the data can be sliced along geographical boundaries, allowing for granular insights into search trends and business presence within specific regions, cities, or even neighborhoods. This offers an easy gateway to evaluate market saturation, competitive landscapes, and emerging opportunities across various sectors by geography. To make things convenient, we've already aligned the businesses to U.S. Census regions, making it easier to compare market and user behaviors with existing research work. The fundamental idea behind the Scout Index is to facilitate in-depth analysis of location-based verticals. This encompasses both the vibrant segment of small to midsize businesses (SMBs), which form the backbone of many economies, and larger multi-location brands that operate on a broader scale. By offering the ability to segment and analyze these diverse business types, the Scout Index provides a nuanced understanding of search performance, discoverability, and brand visibility across the entire spectrum of commercial entities. This detailed understanding is crucial for optimizing search strategies, identifying areas for growth, and supporting businesses of all sizes in enhancing their brand visibility.
 Figure 3 - The Scout Index has 2.7 million businesses categorized across seven core verticals.
Beyond merely segmenting data by individual categories, a more profound set of insights emerges when examining the intricate relationships within these categories. For example, we can identify brand visibility features that have a stronger signal in local visibility. For example, a preliminary look at three separate verticals reveals that best practices are only a starting point. Google's algorithms are clearly favoring certain traits over others based on the business category (Iannelli et al., 2025).
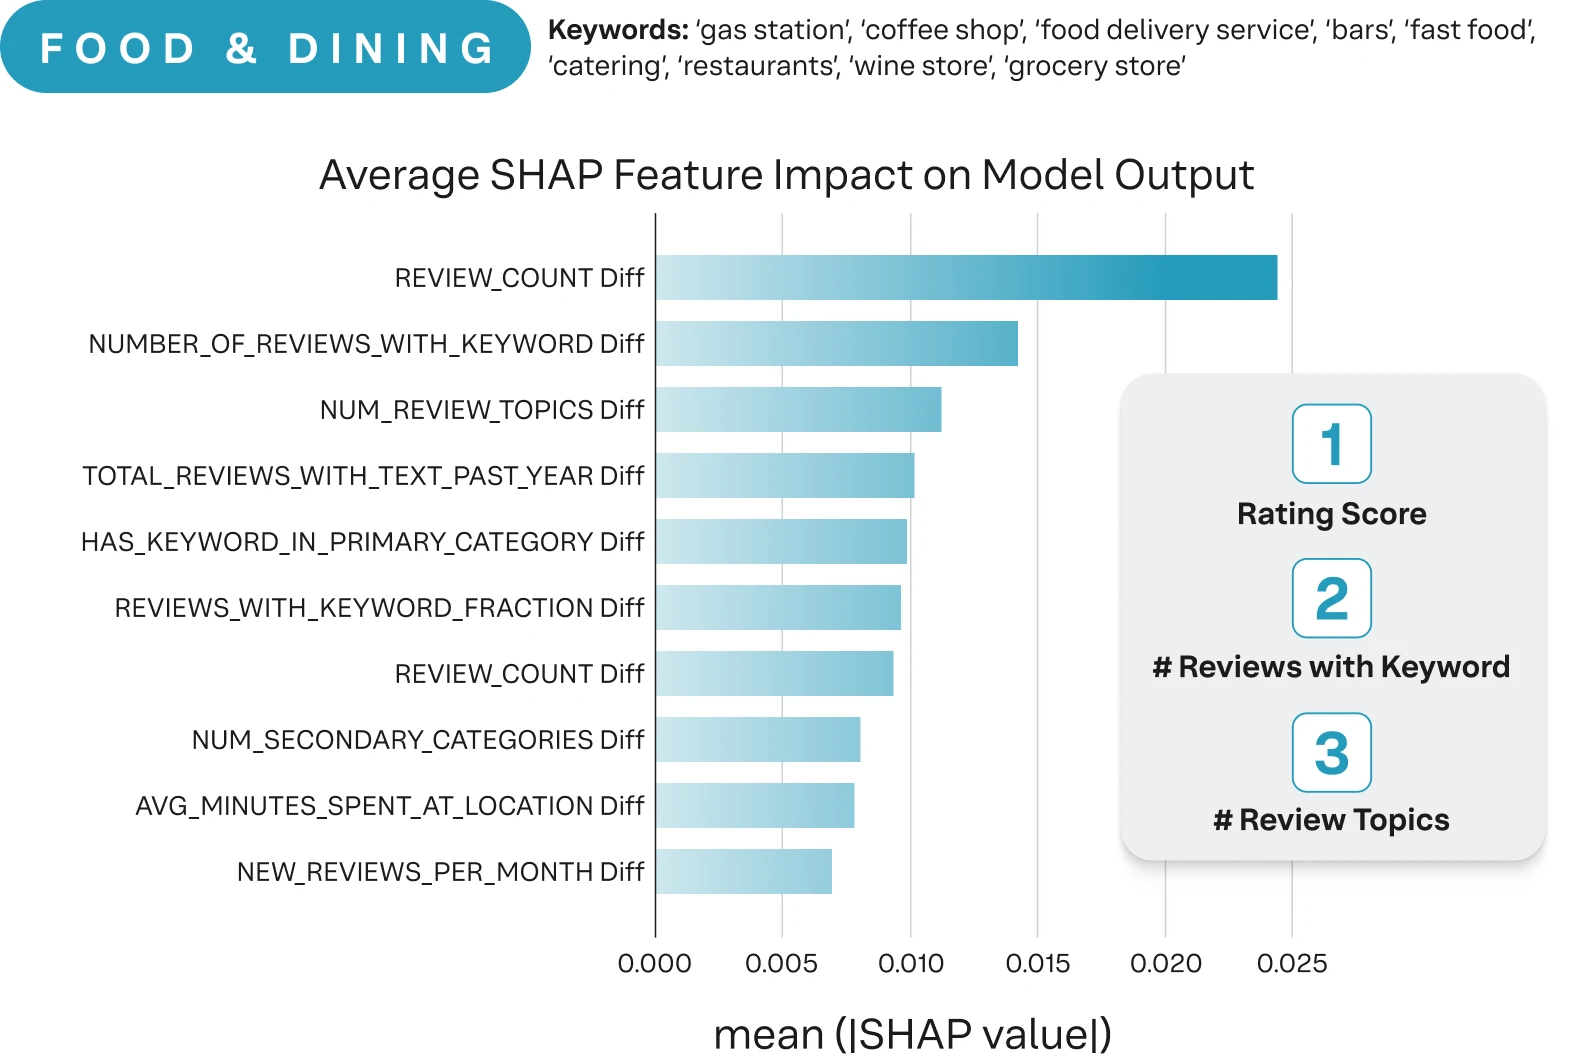
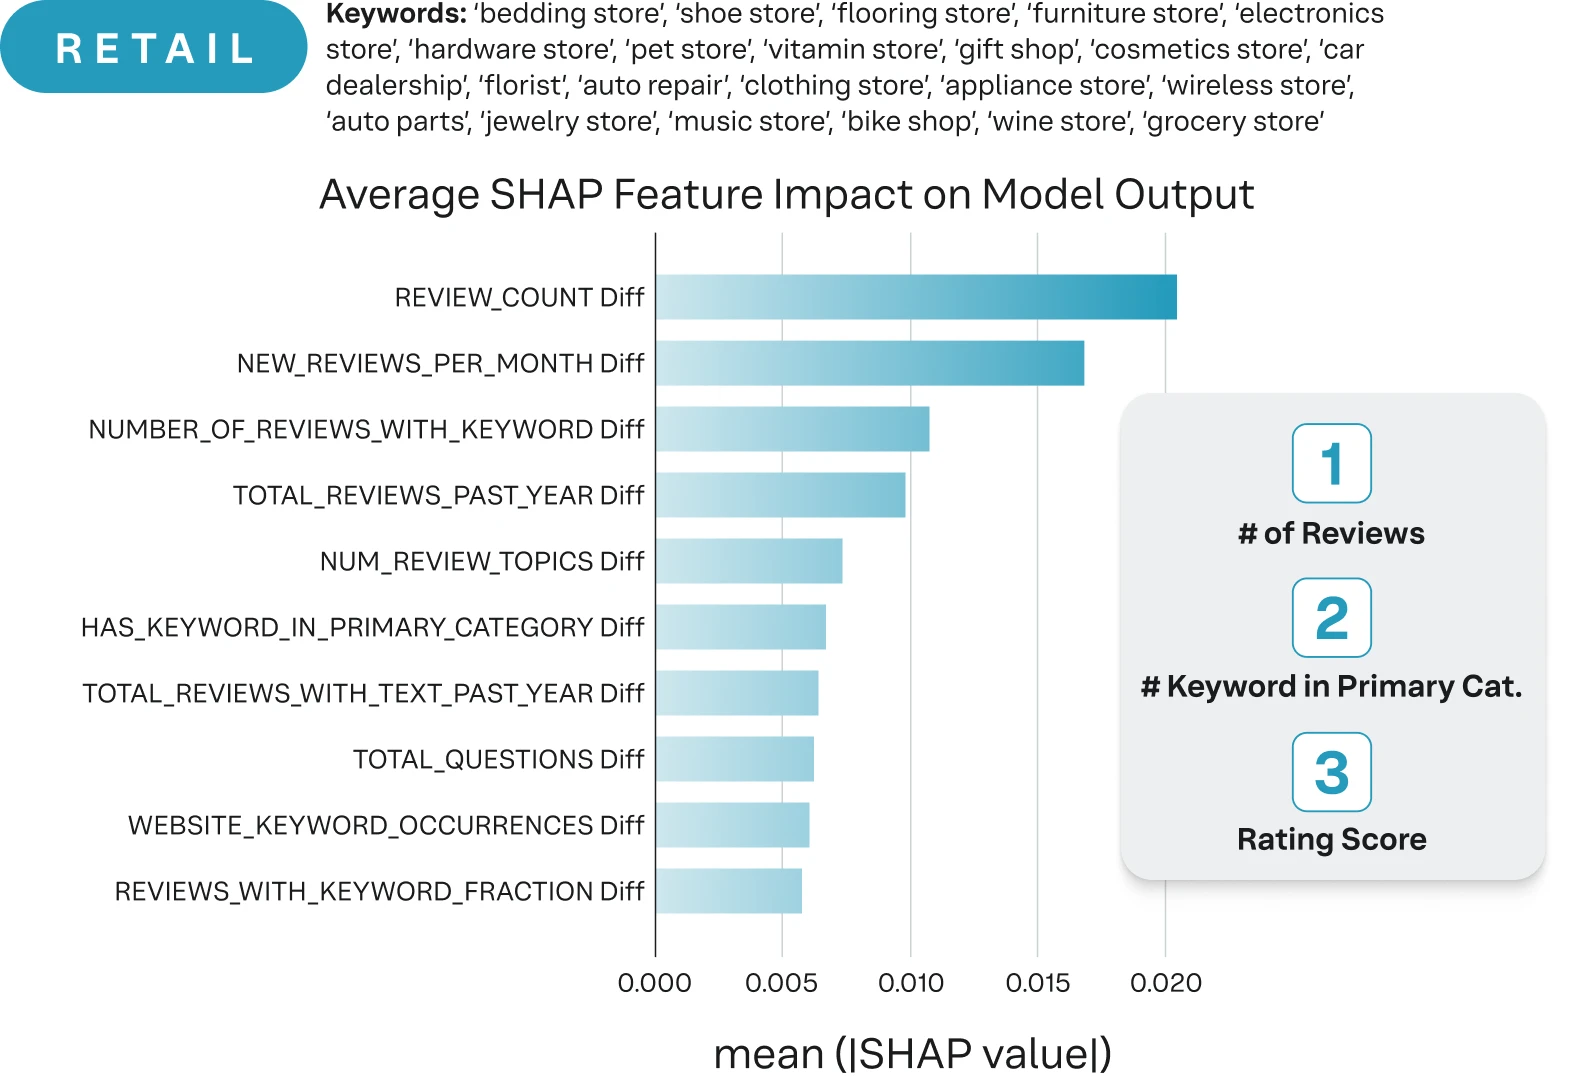 Figure 4 - Highlights the changes in signal preference when looking at digital visibility across industries (Iannelli et al., 2025).
Taking this in another direction, we took a cursory look at the relationships between keywords, primary, and secondary categories (Google listing attributes) at a location-by-location level. In this example, we examined the term "massage therapist" and then dissected its primary and secondary related categories. We quickly observe sophisticated mechanisms by which search algorithms construct connections and map terms. This granular understanding reveals how seemingly disparate terms are, in fact, interwoven within a complex semantic web, shedding light on the underlying logic that drives search engine results.
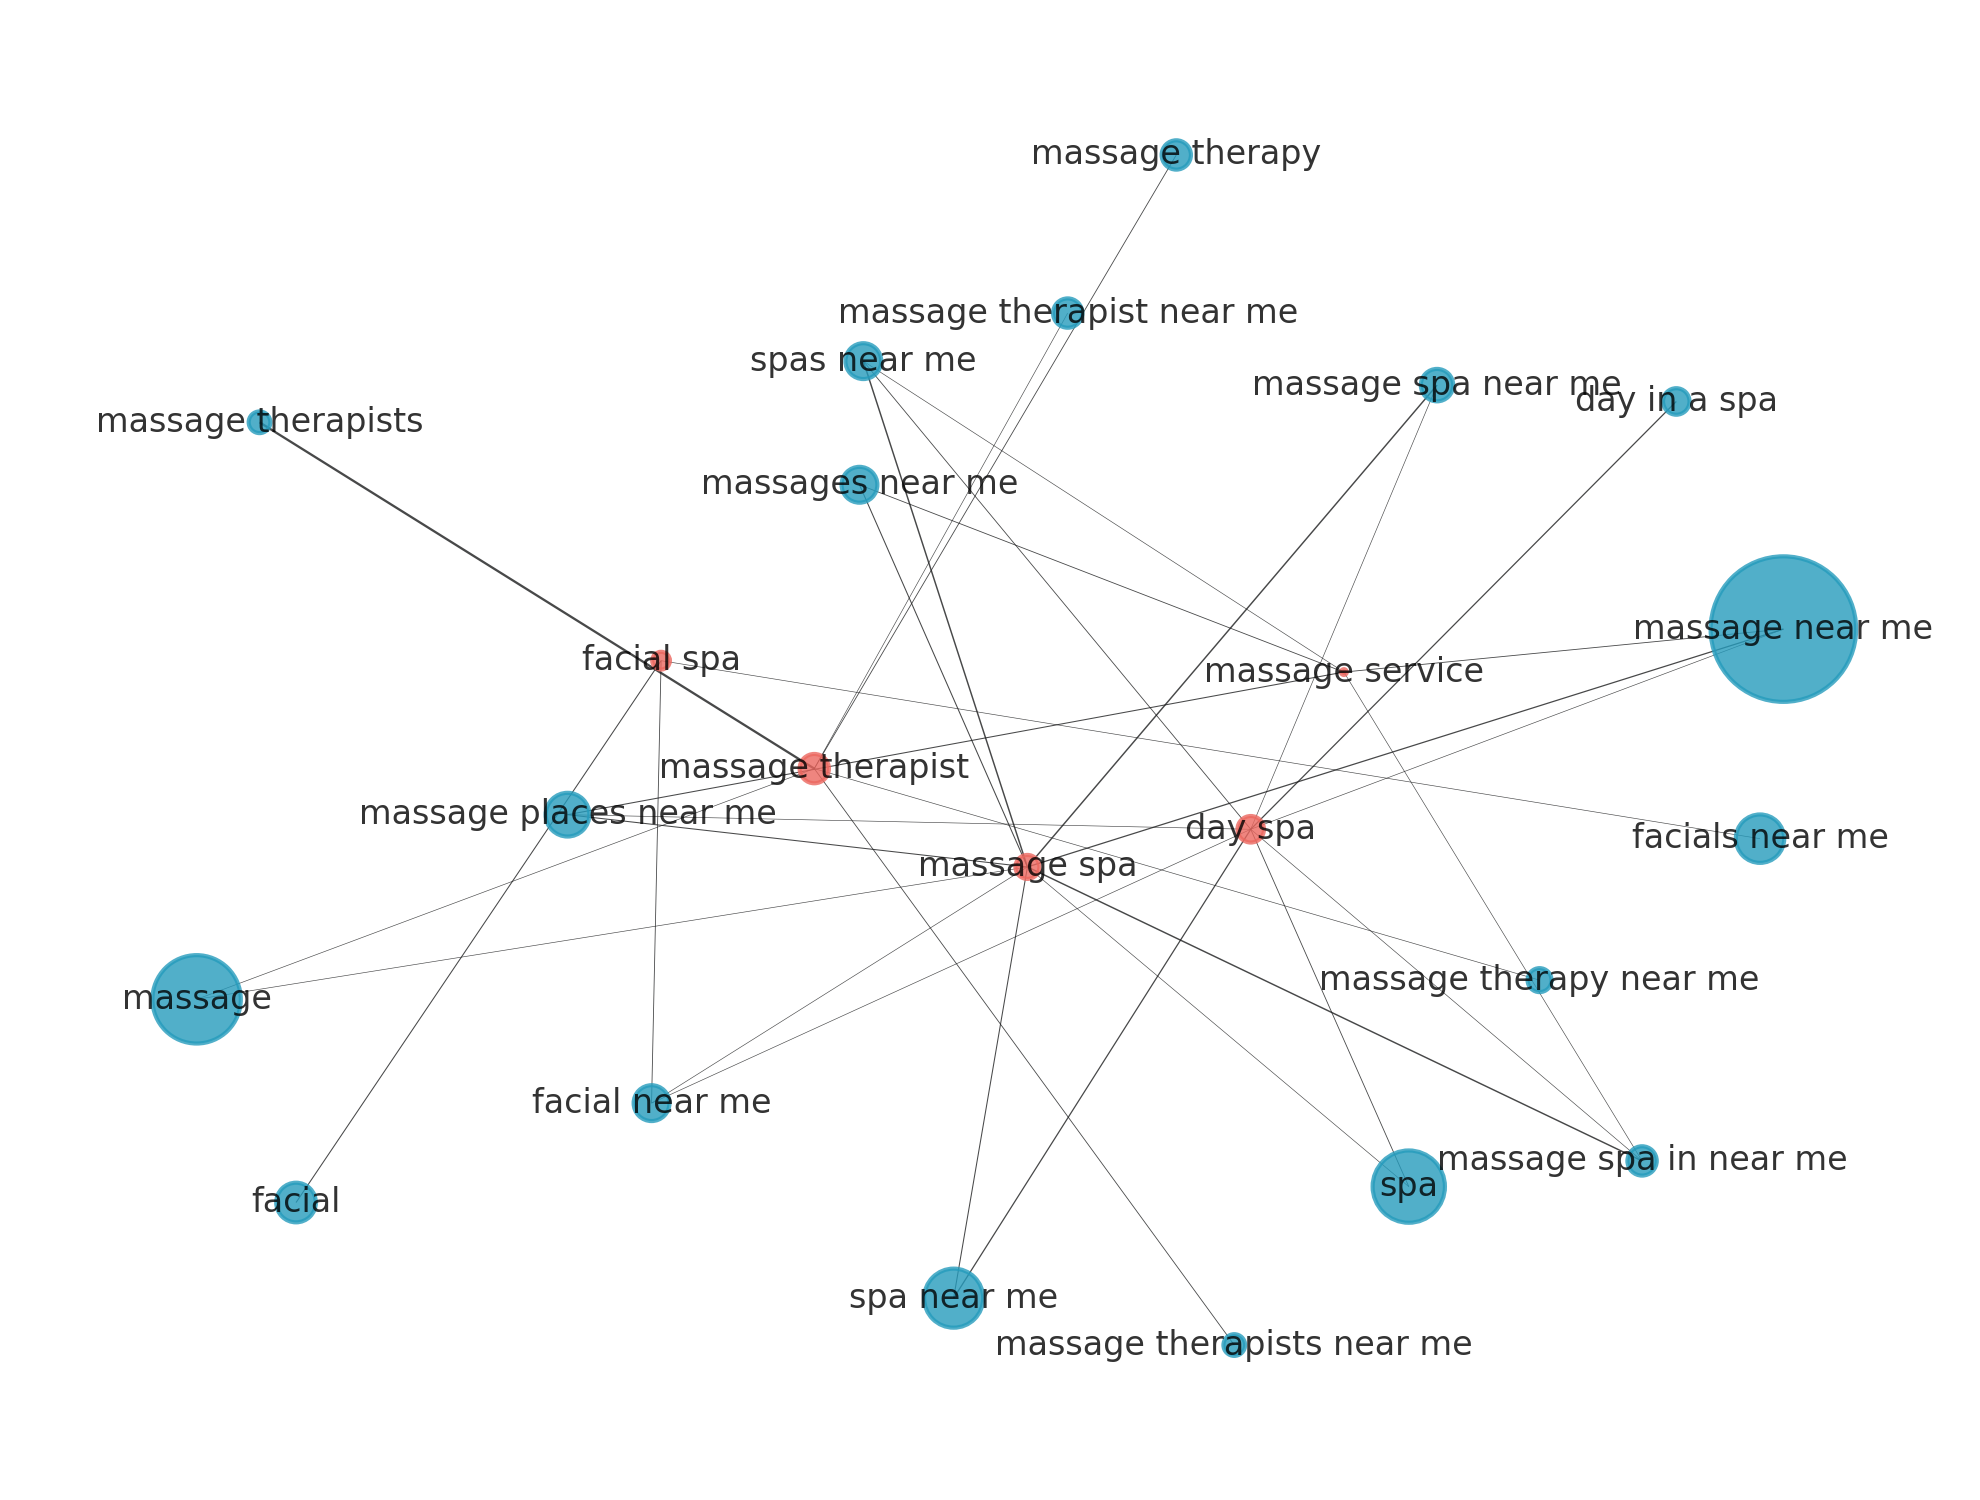 Figure 5 - A network map of connections between keywords and intersecting categories. (Martino and Abernathy, 2025)
Unlocking these keyword maps yields several compelling applications and opens up further research avenues. Firstly, the ability to discern algorithmic linkages offers an opportunity for marketers to optimize their local bidding strategies. By directly correlating the identified relationships with cost-per-click (CPC) data, businesses could more accurately predict localized CPC expenditures. This predictive power allows for more efficient budget allocation, improved return on investment (ROI) on advertising campaigns, and the ability to identify untapped opportunities for cost-effective keyword targeting.
Perhaps of even more significance, integrating this relational understanding with our proprietary AI citations data should help us unlock the knowledge graph mapping behaviors of AI/agentic search. This deeper insight could revolutionize how content is optimized for AI consumption, leading to more prominent and authoritative citations within AI-generated responses and summaries. Furthermore, it could empower content creators to strategically structure their information to enhance its discoverability and credibility within the evolving landscape of AI-powered information retrieval. This research direction promises to unlock new frontiers in content strategy, SEO, and the very architecture of knowledge representation in the age of artificial intelligence.
Figure 5 - A network map of connections between keywords and intersecting categories. (Martino and Abernathy, 2025)
Unlocking these keyword maps yields several compelling applications and opens up further research avenues. Firstly, the ability to discern algorithmic linkages offers an opportunity for marketers to optimize their local bidding strategies. By directly correlating the identified relationships with cost-per-click (CPC) data, businesses could more accurately predict localized CPC expenditures. This predictive power allows for more efficient budget allocation, improved return on investment (ROI) on advertising campaigns, and the ability to identify untapped opportunities for cost-effective keyword targeting.
Perhaps of even more significance, integrating this relational understanding with our proprietary AI citations data should help us unlock the knowledge graph mapping behaviors of AI/agentic search. This deeper insight could revolutionize how content is optimized for AI consumption, leading to more prominent and authoritative citations within AI-generated responses and summaries. Furthermore, it could empower content creators to strategically structure their information to enhance its discoverability and credibility within the evolving landscape of AI-powered information retrieval. This research direction promises to unlock new frontiers in content strategy, SEO, and the very architecture of knowledge representation in the age of artificial intelligence.
AI and traditional search citations
A topic consistently surfacing amongst marketers is: "What does the AI know or say about me?" As traditional search continues to fragment, we recognize that AI citations will become the new currency and a core pillar of discoverability playbooks going forward. Knowing what makes a webpage more likely to be cited by AI search engines (SGEs) is going to be the next big question on everyone's mind. Alongside the Scout index, we are prototyping an AI citation dataset derived from a matrix of objective vs. subjective and branded vs. unbranded AI queries. Currently, this dataset contains more than 27,000 URLs from two primary sources: pages cited by SGEs (Perplexity, Gemini, and ChatGPT) and citations from traditional Google search engine results pages (SERPs). Each URL was then processed to extract a series of technical metrics and the cited or quoted text. Technical metrics include simple counts (such as the number of words or images on the page), writing-related measures (such as reading ease or average sentence length), and structural data (such as whether the page used schema markup or had a sitemap). The parsing also checks the proportion of images with alt text, indicating whether the content is designed with accessibility in mind.
| Total Citations | Unique TLD | |
|---|---|---|
| Perplexity | 12,999 | 5,311 |
| Gemini | 6,338 | 3,815 |
| ChatGPT | 4,261 | 1,760 |
| Traditional SERP | 3,935 | 2,773 |
| 27,533 | 13,659 |
Table 3 - The current size of this adjunct dataset is 27,533 citations sourced from Perplexity, Gemini, and ChatGPT (real-time citation response). "Non-SGE" represents a sample of URLs that showed up in SERP results but not in SGE citations when searching for the same keywords. It represents the overlap of traditional Google Search (i.e., the URLs that are cited in a SERP but not by SGEs).
Initial observations reveal:
- Each model returns largely distinct citations and domains. Domain overlap between any two tops reaches a mere 4.5 percent.
- Perplexity has the highest domain overlap. Add its cross-system percentages, and it reaches 11 percent at the domain level. In plain terms, Perplexity is the likeliest to echo sources you might have already seen elsewhere, helpful when you want corroboration rather than novelty.
- Gemini chooses the quiet corner. It shares only 1.3 percent of domains with ChatGPT. Users who value a fresh bibliography may appreciate that isolation, though fact‑checkers may find the model harder to audit.
- ChatGPT splits the difference. It pairs modestly with Perplexity at 4.5 percent domains, yet remains distant from Gemini and the traditional results. The pattern hints at a retrieval pipeline that balances mainstream and distinctive material without leaning too far either way.
- Finally, the classic search engine continues to march to its own drum. Citation overlap with any AI model is below 2 percent for domains, indicating that conventional search covers a wider slice of the web.
Overlapping Domain Names
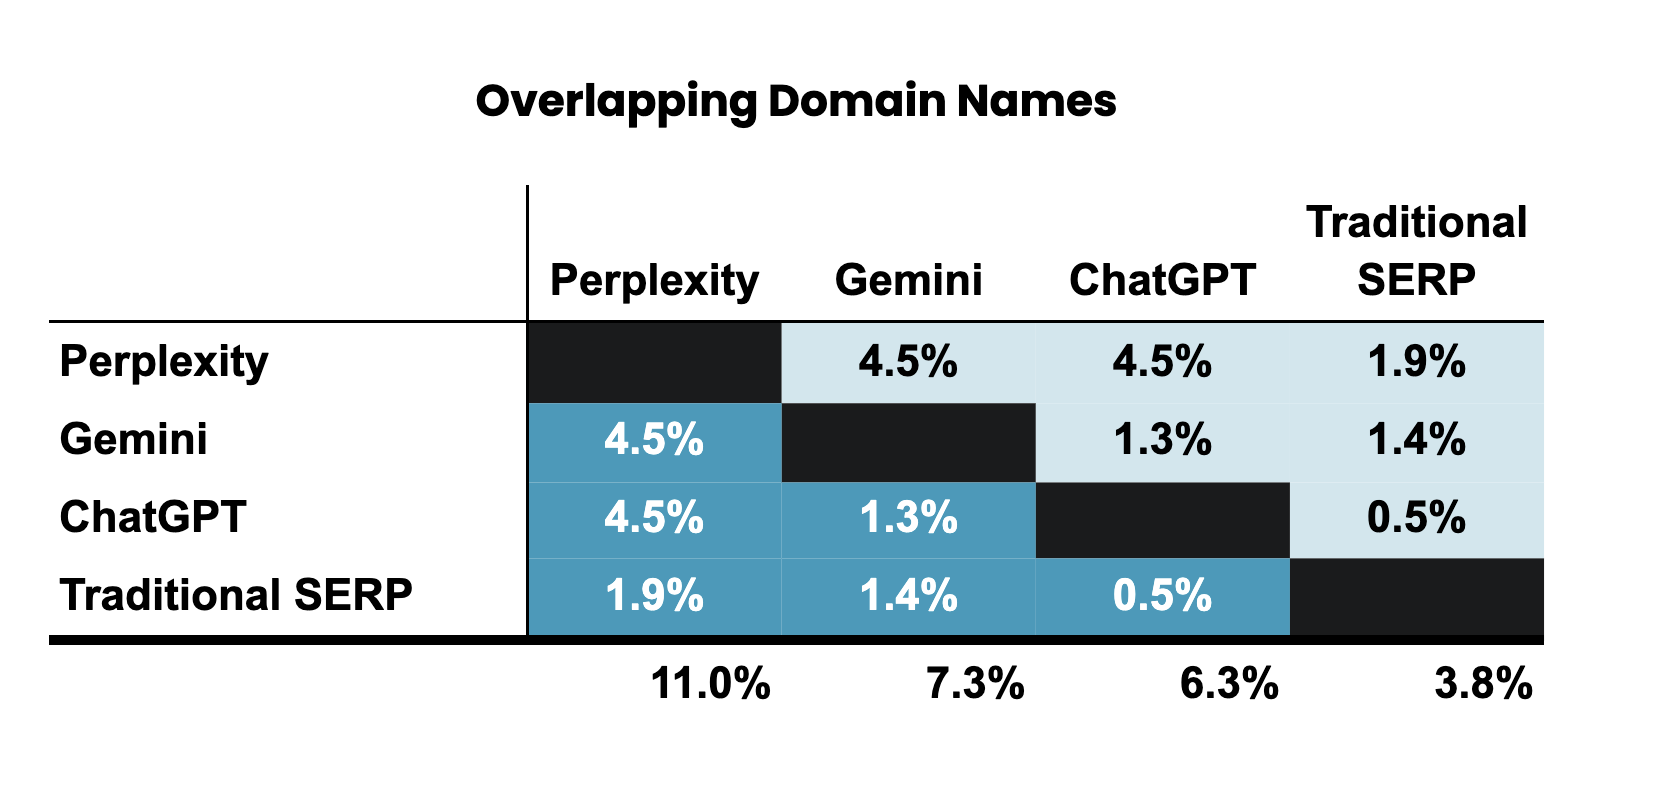 Table 4 - There's a lot of space for citations. There's minimal overlap in citation across models when they are asked the same questions. This signals there's more room to discover "what makes a good citation". "Traditional SERP" is the result of classic Google Search.
This is still early and novel work. We feel this approach provides us a fair side-by-side comparison between pages that generative AI models chose to cite and those that traditional search engines surfaced.
Conclusion
The Scout Index is a new tool for researching digital brand visibility. Rather than relying on surface-level ranking metrics, it provides a multidimensional view into brand visibility, capturing not just who ranks, but why they rank. By analyzing search outcomes through the lens of actual user intent and pairing it with technical site data, listing attributes, and review dynamics, we can begin to understand the real-world signals that shape discoverability in today's fragmented search ecosystem. This observatory model isn't static. It's designed for scale and evolution, capable of tracking billions of monthly data points, allowing us to detect shifts and movements in local, vertical, and AI-driven search. Its structure enables the identification of performance patterns not only by industry or keyword, but also by regional variation, content strategy, and technical implementation. The Scout Index lays the groundwork for understanding not only traditional visibility but also the emerging field of AI citations. As AI-generated responses begin to displace traditional SERPs, knowing what influences citation and how those citations are earned is critical. By comparing citation patterns across multiple generative platforms and linking them back to site structure and content features, we gain early insight into the architecture of AI-driven discovery. This knowledge is vital for marketers seeking to future-proof their SEO strategies. Ultimately, this is more than a dataset. It's an invitation to diagnose how digital visibility is defined and measured. From competitive benchmarking to knowledge graph mapping, the Scout Index equips brands and researchers with the tools to answer today's questions and anticipate tomorrow's. In a search environment increasingly shaped by AI, automation, and user context, visibility is no longer just about presence. It's about understanding the signals, structures, and strategies that drive discoverability and visibility at scale.
Authors: Adam Abernathy, Lilla Szabo, and Christian Ward